
The ASX 200 rallied as a sharp drop in oil prices released the pressure valve on miners and lifted risk appetite. Gold miners, materials, and financials stocks led, while defensives were left off the shopping list.
Be sure to click/scroll through for the usual reporting of the major sector and stock-specific moves, the broker responses to them, as well as all the key economic data in tonight's Evening Wrap. Also, I have detailed technical analysis on the Nasdaq Composite and the S&P/ASX 200 in today's ChartWatch.
Let’s dive in!
Today in Review
Name | Value | % Chg |
|---|---|---|
Major Indices | ||
| ASX 200 | 9,129.0 | +1.10% |
| All Ords | 9,267.8 | +1.14% |
| Small Ords | 3,305.0 | +2.29% |
| All Tech | 3,043.6 | +0.56% |
| Emerging Companies | 2,850.3 | +1.60% |
Currency | ||
| AUD/USD | 0.6924 | -0.03% |
US Futures | ||
| S&P 500 | 7,591.75 | +0.23% |
| Dow Jones | 52,693.0 | +0.37% |
| Nasdaq | 28,038.25 | +0.08% |
Name | Value | % Chg |
|---|---|---|
Sector | ||
| Industrials | 8,555.5 | +2.31% |
| Real Estate | 3,524.3 | +2.23% |
| Materials | 23,598.4 | +1.48% |
| Financials | 9,808.4 | +1.12% |
| Consumer Discretionary | 3,806.2 | +0.56% |
| Energy | 10,358.9 | +0.49% |
| Information Technology | 1,804.7 | +0.31% |
| Health Care | 35,163.4 | +0.20% |
| Communication Services | 1,642.0 | +0.12% |
| Consumer Staples | 13,769.4 | -0.20% |
| Utilities | 10,618.8 | -0.38% |
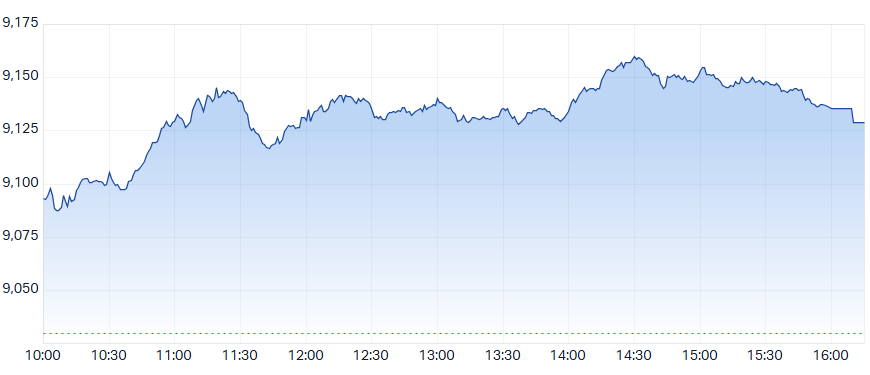
ASX 200 Intraday Chart
Markets
The S&P/ASX 200 (XJO) finished 99.3 points higher at 9,129.0, 1.1% from its session low and 0.34% from its low. Matching the enthusiasm at benchmark level, in the broader-based S&P/ASX 300 (XKO) advancers beat decliners by a convincing 253 to 36.
The Gold Sub-Index (XGD) (+2.3%) led the market as the tumbling oil price handed gold miners a double tailwind. COMEX gold futures rose 0.2% to US$4,122.20/oz in the Asian session after gaining 1.0% overnight, while cheaper oil promises relief from the acutely high diesel costs miners have been battling. Ora Banda Mining (OBM) (+7.2%) and Black Cat Syndicate (BC8) (+3.7%) were standouts. Genesis Minerals (GMD) (+3.1%) and Northern Star Resources (NST) (+3.0%) also rallied, while Newmont (NEM) (+1.1%) gained.
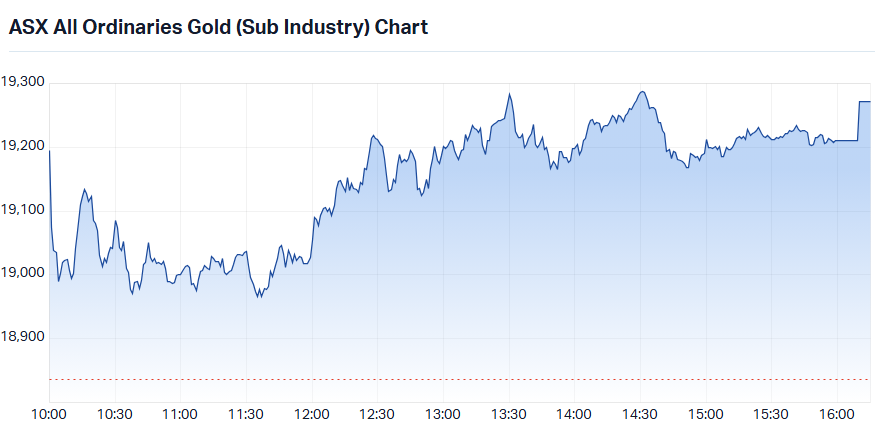
S&P/ASX 200 All Ordinaries Gold (Sub Industry) intraday chart
Materials (XMJ) (+1.5%) extended its rebound as the oil slump took more diesel cost pressure off miners and base and critical minerals prices firmed. COMEX copper futures rose 0.1% to US$6.353/lb in the Asian session after jumping 1.7% overnight. Nickel Industries (NIC) (+4.9%) and Sims (SGM) (+2.4%) led base metals stocks higher, while South32 (S32) (+1.3%) also gained. BHP Group (BHP) (+1.1%) rebounded from last week’s fears that a slowdown in the AI build-out could hit its copper business.
Iron ore stocks also firmed as SGX iron ore futures edged 0.2% higher to US$92.85/t, with Champion Iron (CIA) (+5.2%) the standout.
Rare earths stocks rallied as NdPr prices in China rose 0.6% to CNY 711,500/t. Arafura Rare Earths (ARU) (+6.7%) and Lynas Rare Earths (LYC) (+4.2%) were the big movers.
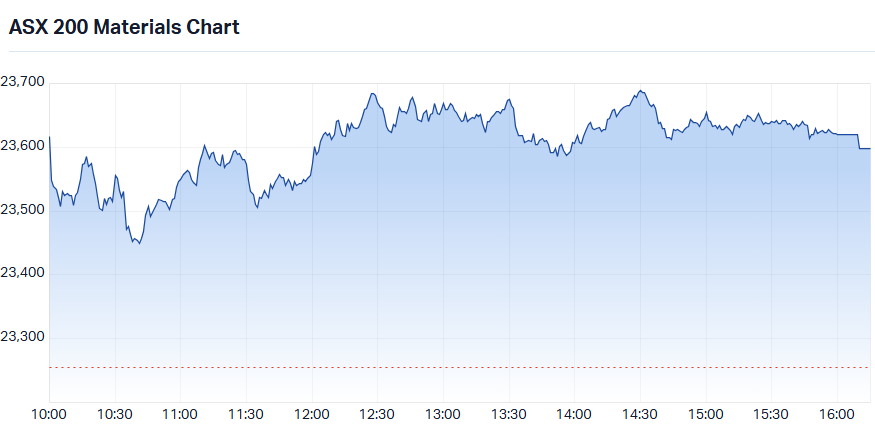
S&P/ASX 200 Materials Sector Index (XMJ) intraday chart
A-REITs (XPJ) (+2.2%) rallied as benchmark bond yields eased overnight and into today, with investors betting that inflation pressures may also unwind, putting less pressure on central banks to lift interest rates. Lower yields help property trusts on two fronts: cheaper debt, and rental income that looks more attractive next to lower-paying bonds. Data centre developer Goodman Group (GMG) (+3.4%) and Lendlease Group (LLC) (+2.9%) led the gains. Stockland (SGP) (+2.5%) and Charter Hall Group (CHC) (+2.2%) followed, while takeover target Ingenia Communities (INA) (+1.5%) gained as Avid matched Warburg Pincus’ latest offer.
Financials (XFJ) (+1.1%) also caught the lower-yield tailwind, with three of the big four banks closing more than 1% higher, including Commonwealth Bank of Australia (CBA) (+1.8%). Fund managers also rode the risk-on mood – their earnings rise and fall with the value of the assets they manage. AMP (AMP) (+3.2%) and Perpetual (PPT) (+2.2%) both rallied.
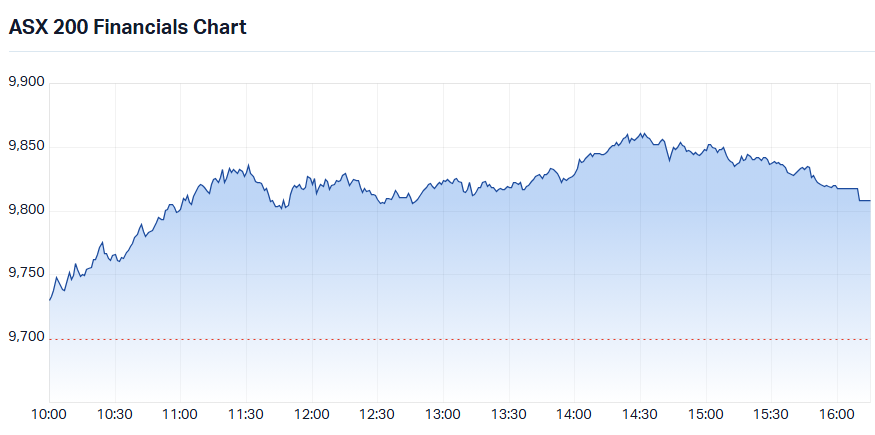
S&P/ASX 200 Financials Sector Index (XFJ) intraday chart
Industrials had a strong session, with Qantas Airways (QAN) (+6.3%) jumping after announcing sweeping job cuts. The lower oil price likely added extra lift, given jet fuel is one of the airline’s biggest costs. Monadelphous (MND) (+15.3%) surged after flagging $1.7 billion in half-year revenue, while Reece (REH) (+3.9%) also rallied. Transurban Group (TCL) (+1.6%) and Brambles (BXB) (+1.0%) gained.
With investors in a buying mood, the market’s defensive corners – the steady earners investors hide in when nervous – drew little buying pressure. Utilities (XUJ) (-0.4%) and Consumer Staples (XSJ) (-0.2%) were the only sectors to close lower, while Communication Services (XTJ) (+0.1%) and Health Care (XHJ) (+0.2%) barely moved.
Across these sectors, Origin Energy (ORG) (-0.4%) (Utilities) and Woolworths Group (WOW) (-0.9%) (CS) dipped, as did Telix Pharmaceuticals (TLX) (-0.9%), while CSL (CSL) (0.0%) was flat (both Healthcare). Among telcos — typically considered utility-style earners — Aussie Broadband (ABB) (-2.4%) and TPG Telecom (TPG) (-1.2%) lost ground.
Interestingly, Energy (XEJ) (+0.5%) finished higher despite being the sector with the most to lose. ICE Brent crude futures fell 1.2% to US$91.50/bbl in the Asian session after plunging 5.9% overnight, when President Trump said fresh attacks on Iran were “highly unlikely”. Refiners and fuel retailers were the standouts, with Viva Energy Group (VEA) (+2.7%) and Ampol (ALD) (+2.2%) rallying.
Thermal coal wasn’t far behind crude, with globalCoal Newcastle coal futures down 3.0% to US$137.70/t. Coal stocks were mixed, though, most likely on the tailwind from lower diesel costs, with Whitehaven Coal (WHC) (+0.4%) inching up.
The oil and gas majors were flat, possibly as investors had already factored in a lower oil price to some extent. Woodside Energy Group (WDS) (+0.1%) edged higher, while Santos (STO) (-0.2%) slipped.
Uranium stocks logged a second strong day of gains, likely as the resumption of the AI trade – and its appetite for power – outweighed a small dip in COMEX uranium futures, down 0.6% to US$92.85/lb. Paladin Energy (PDN) (+5.0%) and Deep Yellow (DYL) (+4.8%) led. NexGen Energy (NXG) (+3.6%) and Boss Energy (BOE) (+3.2%) also rallied.
Today's best ASX Top 300 gainers
Company | Last Price | Change $ | Change % | 1mo % | 1yr % |
|---|---|---|---|---|---|
| Monadelphous Group (MND) | $32.63 | +$4.33 | +15.3% | +5.9% | +30.5% |
| IperionX (IPX) | $2.47 | +$0.32 | +14.9% | +12.3% | -58.3% |
| Ora Banda Mining (OBM) | $1.64 | +$0.11 | +7.2% | +12.3% | +36.1% |
| Metals X (MLX) | $1.725 | +$0.115 | +7.1% | -15.4% | +110.4% |
| Arafura Rare Earths (ARU) | $0.16 | +$0.01 | +6.7% | -3.0% | -41.8% |
| Megaport (MP1) | $18.45 | +$1.11 | +6.4% | -1.8% | +24.8% |
| Southern Cross Electrical Engineering (SXE) | $3.84 | +$0.23 | +6.4% | -17.1% | +67.7% |
| SRG Global (SRG) | $3.51 | +$0.21 | +6.4% | -8.4% | +26.7% |
| Qantas Airways (QAN) | $9.90 | +$0.59 | +6.3% | +16.2% | +1.7% |
| Imdex (IMD) | $3.48 | +$0.20 | +6.1% | +3.3% | -0.3% |
| Forrestania Resources (FRS) | $0.35 | +$0.02 | +6.1% | +9.4% | +100.0% |
| NRW Holdings (NWH) | $6.49 | +$0.37 | +6.0% | -14.0% | +31.9% |
| Mader Group (MAD) | $5.79 | +$0.33 | +6.0% | -10.1% | -34.2% |
| Macmahon Holdings (MAH) | $0.99 | +$0.055 | +5.9% | -10.8% | +102.0% |
| FDC Consolidated Holdings (FDC) | $3.53 | +$0.18 | +5.4% | -9.7% | +17.7% |
| Champion Iron (CIA) | $2.21 | +$0.11 | +5.2% | -21.1% | -59.1% |
| Downer EDI (DOW) | $7.30 | +$0.36 | +5.2% | +6.1% | -6.6% |
| Brightstar Resources (BTR) | $0.715 | +$0.035 | +5.1% | +8.3% | +57.1% |
| Paladin Energy (PDN) | $8.68 | +$0.41 | +5.0% | +3.5% | +3.6% |
| Minerals 260 (MI6) | $0.85 | +$0.04 | +4.9% | +3.0% | +169.8% |
Today's worst ASX Top 300 losers
Company | Last Price | Change $ | Change % | 1mo % | 1yr % |
|---|---|---|---|---|---|
| Life360 Inc (360) | $18.91 | -$3.42 | -15.3% | -7.0% | -60.9% |
| Superloop (SLC) | $2.47 | -$0.28 | -10.2% | -2.0% | -18.2% |
| Service Stream (SSM) | $2.07 | -$0.13 | -5.9% | -8.0% | -8.0% |
| Channel Infrastructure NZ (CHI) | $2.69 | -$0.11 | -3.9% | -3.9% | +6.3% |
| The Star Entertainment Group (SGR) | $0.165 | -$0.005 | -2.9% | +32.0% | +85.4% |
| Vulcan Steel (VSL) | $5.71 | -$0.14 | -2.4% | +4.4% | -20.3% |
| Aussie Broadband (ABB) | $4.50 | -$0.11 | -2.4% | +8.4% | -21.1% |
| Cobram Estate Olives (CBO) | $2.72 | -$0.05 | -1.8% | -6.2% | -15.0% |
| BCI Minerals (BCI) | $0.55 | -$0.01 | -1.8% | -3.5% | +42.9% |
| Nanosonics (NAN) | $2.85 | -$0.04 | -1.4% | +0.4% | -33.7% |
| Xero (XRO) | $69.63 | -$0.95 | -1.3% | +16.4% | -51.3% |
| TPG Telecom (TPG) | $3.99 | -$0.05 | -1.2% | +2.8% | -29.1% |
| Dyno Nobel (DNL) | $3.36 | -$0.04 | -1.2% | -17.4% | -2.9% |
| Plato Income Maximiser (PL8) | $1.37 | -$0.015 | -1.1% | -1.8% | -3.5% |
| MA Financial Group (MAF) | $4.90 | -$0.05 | -1.0% | +4.9% | -48.9% |
| Zimplats Holdings (ZIM) | $14.38 | -$0.14 | -1.0% | -4.1% | -22.1% |
| Telix Pharmaceuticals (TLX) | $13.80 | -$0.13 | -0.9% | -12.9% | -9.9% |
| Woolworths Group (WOW) | $42.08 | -$0.39 | -0.9% | +6.3% | +50.1% |
| Domino's Pizza Enterprises (DMP) | $22.26 | -$0.19 | -0.8% | +0.3% | +18.5% |
| Genesis Energy (GNE) | $1.935 | -$0.015 | -0.8% | -1.3% | -8.1% |
Chartwatch
Nasdaq Composite Index
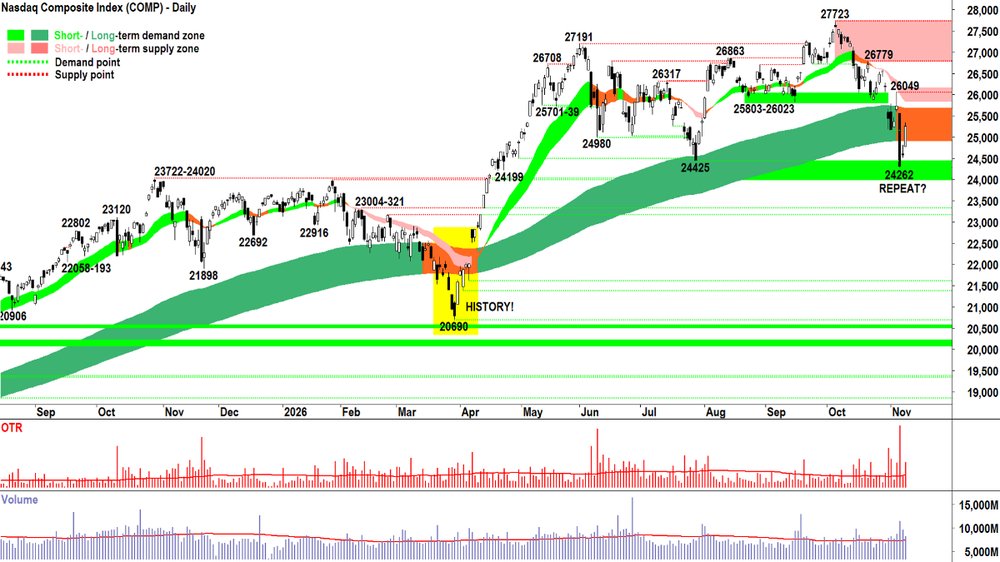
Nasdaq Composite Index chart
Analysis
History doesn't repeat, but it sure does rhyme.
Said some smart person a long time ago...
Probably a stock market trader. Probably on the Comp! 🤣
"If that's the case Carl... i.e., whenever the Comp looks terrible... it reverses and storms to a new high. Why then, don't you tell us all to buy every time the Comp looks like you-know-whatting-itself? I mean look at what happened in March-April. It's just going to happen again!"
I hear you complain. 😠
You have a point. In hindsight, I probably should do this. I probably should have done it yesterday.
But we can't make live decisions with the benefit of hindsight. The you-know-what always looks bloody obvious in hindsight — Harry my friend! 😉
All I know in that "live moment" is what D and S are telling me about who's in control of the price... the demand side or the supply side.
And as much as the COMP IS AN ABSOLUTE BEAST — I must make my calls solely based on the MOTN scenario prescribed by the data. And that data, up until Friday's close, suggested S > D = P ⬇️ MOTN.
Indeed, we both know what the Comp is capable of. Just like olives have pits, it's in the Comp's nature to rise. The Comp is the coalface of investor animal spirits — it has been since about 1996 from my memory. 🫒
So we're not surprised by Monday's candle. And yes, (bloody hell 🤦!) it does look a great deal like what occurred in March-April (and the time before that, and the time before that... etc. etc.!).
Well, that's it. That's the turn. FRP!!! 🤔
Again, not how I work. I require an uptrend to make that call... at the very least:
Price closed above ST trend ribbon, short term trend ribbon is rising and is acting as a zone of dynamic demand.
Price closed above the LT trend ribbon, long term trend ribbon back to dark green / rising and is acting as a zone of dynamic demand
Rising peaks and rising troughs = BTD plus a return to FOMO and HOFU
Predominance of demand side candles (i.e., those which white bodies and or downward pointing shadows — preferably a few long ones (above average volatility) on above average volume)
We're not there yet. Also consider, there's 1/2RP and 2/3RP on the way to FRP. We won't need all of the above to simply move back to 1/2RP. It could be as little as only Point 1 and Point 4.
So, there's some work required from the demand side to convince me they're back in control. And It's the Comp, so it can happen quickly.
That's good and bad. We'd love a return to a strong bull market — strong bull markets tend to be a great, low volatile place to make money. BUT I may miss quite a bit of upside before I observe the requisite signals...
I may end up being a victim of my own disciplined approach... I accept this possibility. That's just trading!
View
I'm at 1/3RP on US stocks. I've discussed this post-webinar before, but my skew even at 1/3RP is still towards long side risk, not short side risk. I've suggested 60-40 long-short or even 70-30. Never the other way round. This is an important distinction — and it respects the fact that bull markets are the NATURAL STATE. 🫒 I'll discuss more in tomorrow's webinar! 📺 (RP = Risk Position – it reflects my personal allowable capital allocation limit for my investments in US stocks. So 1/2RP is 50%, 2/3RP is 67% and FRP is 100%).
Key Levels
The long term trend ribbon is the closest (dynamic) zone of supply (presently 24910-25691) but the short term trend ribbon (presently 25841-26084) is likely the critical go-no-go for the current short term downtrend. There appears to be a substantial zone of potential latent demand between 23722-24425.
S&P/ASX 200 (XJO)
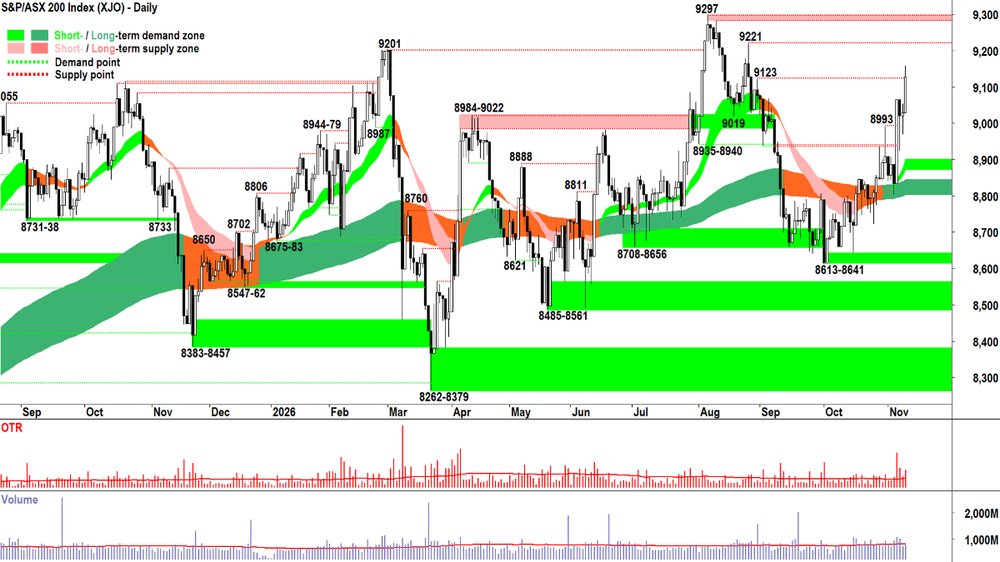
S&P/ASX 200 (XJO) chart
Analysis
There's no doubt about who's in control of this market. Also, I suggest we're well placed at the current RP setting of 2/3RP.
Since I've been back from my holiday, I've started the last two webinars by saying that the crude oil price is going to be the biggest swing factor for stock, bond and commodity markets going forward. A major correction in crude would flip the 2026 script.
And it has.
And we're withing spitting of a new all time high on the OTP.
Which as much as, let's face it, it remains an Old Tin Pot, is appears to be suddenly be a highly very highly sought after Old Tin Pot!
You know what they say about mediocrity. Let's hope so! 🤞
View
I am at 2/3RP on Australian shares (i.e., 67% invested vs 33% cash, with some of the invested portion allocated to shorts). Happy to use the full risk allocation if I can find suitable setups. Let me see how the OTP performs around 9221-9297 before contemplating a potential move to FRP!
Key Levels
9221-9297 is the closest zone of supply. The short term trend ribbon is the closest zone of (dynamic) demand (presently 8870-8899).
(Glossary of acronyms! Old Tin Pot (OTP): S&P/ASX 200 | MOTN: More Often Than Not | FOMO: Fear Of Missing Out | HOFU: Holding On For Upside | BTD: Buy The Dip | NUTE: No Urgency To Enter | FOHO: Fear Of Holding On | STR: Sell The Rally | RP: Risk Position | FFS: Fund Flow Shenanigans!)
***CHARTWATCH LIVE — LITHIUM & COPPER ON ALERT! 🚨📺***
ChartWatch LIVE Webinar
ChartWatch LIVE Webinars – WEEKLY Wednesday's @ 12pm AEDT
Learn more about technical analysis and trend following through real case studies on ASX stocks. Australia's premier technical analyst, Carl Capolingua, shares his unique insights on stocks as requested by viewers. Ask about a company in your portfolio or anything related to trading and investing and get Carl's expert opinion.
Places are limited so >REGISTER NOW!<
Economy
TODAY
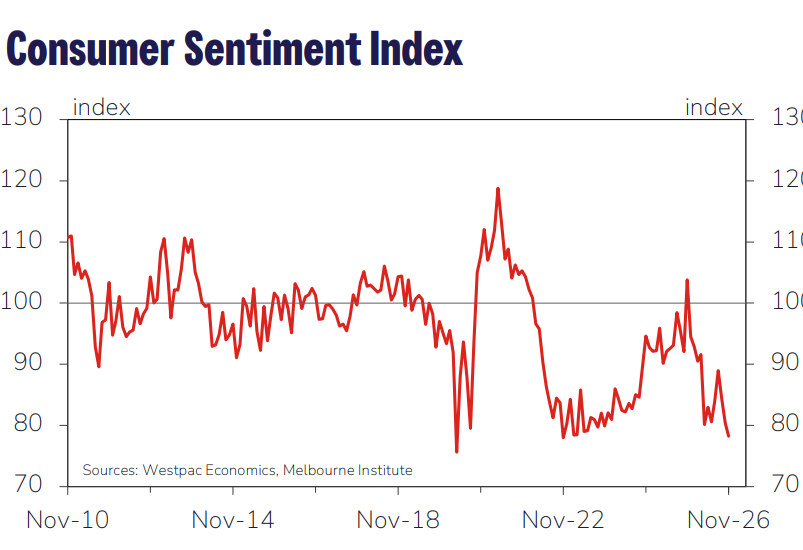
AUS October Westpac Consumer Sentiment
-2.7% to 78.2 (vs 80.4 in September) = 4 year low
Westpac economists noted a "sharp deterioration" in the near-term outlook for the Australian economy with >70% of consumers surveyed expecting a further rise in mortgage rates, as well as a "big downgrade" house price expectations. Fears over job security "rising gradually" with consumers "still not overly alarmed". Christmas spending likely tighter.
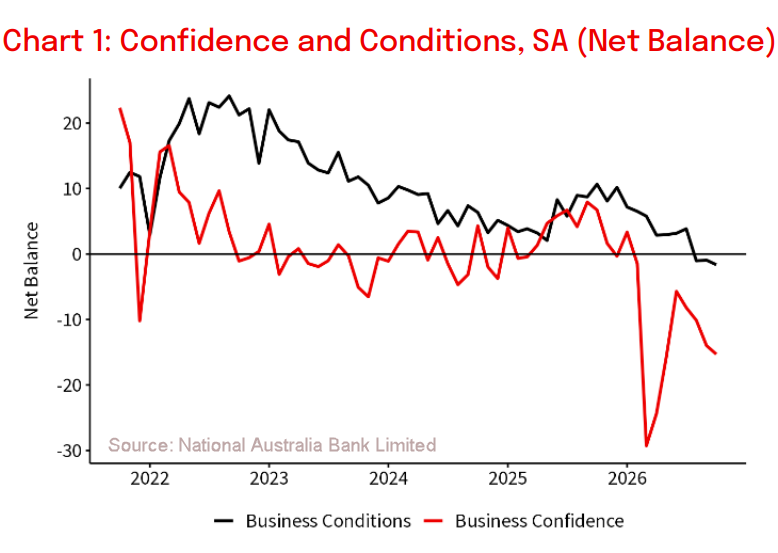
AUS NAB Business Confidence
Confidence -1 point to -15 index points (consider the long run average is +4 index points!)
Conditions -1 point to -2 index points (ditto +7 index points!)
Businesses noted softer trading conditions and profitability, "notable softening" in forward orders.
NAB economists said current conditions and trends "may drive some softening in labour demand over coming months", although employment has been "resilient".
"However, despite the slowing in activity, the survey suggests the economy continues to operate near its capacity. This may be one reason for the RBA’s recently expressed concerns about the supply side capacity of the domestic economy." — NAB said.
LATER THIS WEEK
WEDNESDAY
00:30 USA October Core CPI (+0.2% m/m forecast vs +0.3% m/m in September)
THURSDAY
00:00 USA All Day — markets closed for Veterans Day
FRIDAY
02:30 AUS CB Leading Index m/m
05:01 USA 30-year bond auction
SATURDAY
00:30 USA October Core PPI (+0.3% m/m forecast vs +0.7% m/m in September)
Interesting Movers
Trading higher
- Monadelphous Group (MND) $32.63+15.3%
Issued a business update. Management said the company is on track for $1.7 billion revenue in the half to Dec 31 and NPAT of $80–$85 million. It had secured $830 million in new contracts since July 1, but also warned that activity may moderate in the second half.
- Qantas Airways (QAN) $9.90+6.3%
Internal note circulated among employees today and picked up by media announced the airline will outsource 850 head‑office jobs to Accenture as part of an IT overhaul. Today's performance very likely also assisted by the lower oil price.
- Ingenia Communities Group (INA) $5.28+1.5%
Announced that Avid Property Group has matched Warburg Pincus’ $5.60‑a‑share takeover bid: $5.55 cash per stapled security plus up to $0.05 cash distribution for the half‑year ending 31 Dec 2026.
Trading Lower
- Life360 Inc (360) $18.91-15.3%
Reported September quarter results. Net income US$22.5 million, monthly active users >107 million, Q3 revenue US$174.1 million (up 40%), operating costs fell to 72% of revenue from 80%, and management forecast FY26 consolidated revenue of US$665–US$681 million.
- Superloop (SLC) $2.47-10.2%
Issued a trading update and FY27 guidance. Management guided FY27 EBITDA to $148–$156 million (21–27% growth on FY26’s $122.7 million) and flagged capex of $58–$62 million (up from $37.9 million).
- Service Stream (SSM) $2.07-5.9%
Announced that it has completed an institutional entitlement offer and placement raising about $404 million. Proceeds to partly fund the $975 million acquisition of Programmed announced yesterday.
Broker Moves
Company | Broker | Action | Rating | Price Target |
|---|---|---|---|---|
360Life360 Inc | Citi | Retained | Buy | $28.80 |
| Macquarie | Retained | Outperform | $30.10 | |
ALLAristocrat Leisure | Macquarie | Retained | Outperform | $67.00 |
ANZANZ Group Holdings | Citi | Downgraded | Neutral(from Buy) | $40.80(from $41.00) |
| Macquarie | Retained | Neutral | $34.00(from $33.50) | |
| Morgan Stanley | Downgraded | Equal Weight(from Overweight) | $35.00(from $35.50) | |
| Morgans | Retained | Trim | $35.71 | |
| Ord Minnett | Downgraded | Lighten(from Hold) | $33.00 | |
APZAspen Group | Citi | Retained | Buy | $6.10 |
AVHAVITA Medical, Inc. | Bell Potter | Retained | Speculative Buy | $6.30(from $3.70) |
CDACodan | Macquarie | Retained | Outperform | $65.60(from $67.70) |
| Ord Minnett | Upgraded | Buy(from Accumulate) | $72.00(from $70.00) | |
CHIChannel Infrastructure NZ | Bell Potter | Initiated | Buy | $3.20 |
CKFCollins Foods | Bell Potter | Retained | Buy | $11.20(from $11.10) |
DNLDyno Nobel | Citi | Retained | Buy | $4.15 |
| Macquarie | Retained | Outperform | $4.20(from $4.35) | |
| Morgan Stanley | Retained | Overweight | $4.80 | |
| Morgans | Upgraded | Accumulate(from Hold) | $3.85(from $4.42) | |
| Ord Minnett | Retained | Hold | $3.40(from $3.80) | |
GYGGuzman Y Gomez | Bell Potter | Retained | Hold | $28.20(from $27.30) |
LDXLumos Diagnostics Holdings | Bell Potter | Retained | Buy | $0.20 |
LNWLight & Wonder Inc. | Macquarie | Retained | Outperform | $190.00 |
MLXMetals X | Ord Minnett | Retained | Buy | $2.20 |
MNDMonadelphous Group | Macquarie | Retained | Outperform | $32.70 |
MPKMany Peaks Minerals | Morgans | Retained | Speculative Buy | $2.14(from $2.48) |
MQGMacquarie Group | Morgan Stanley | Retained | Overweight | $277.00(from $273.00) |
NSTNorthern Star Resources | Canaccord Genuity | Retained | Hold | $26.10(from $26.20) |
PFPPropel Funeral Partners | Macquarie | Retained | Outperform | $4.70(from $4.85) |
| Morgan Stanley | Retained | Overweight | $4.45 | |
QBEQBE Insurance Group | Macquarie | Retained | Outperform | $26.60(from $26.20) |
SCGScentre Group | Ord Minnett | Downgraded | Hold(from Accumulate) | $3.60(from $3.75) |
SIQSmartgroup Corporation | Bell Potter | Retained | Hold | $11.90(from $11.80) |
| Macquarie | Retained | Neutral | $11.51(from $11.31) | |
| Morgan Stanley | Retained | Overweight | $13.00 | |
| Ord Minnett | Retained | Buy | $13.10 | |
SLCSuperloop | Citi | Retained | Buy | $3.70 |
SLSSolstice Minerals | Canaccord Genuity | Retained | Speculative Buy | $4.05 |
SSMService Stream | Morgan Stanley | Retained | Overweight | $2.90 |
USLUnico Silver | Canaccord Genuity | Retained | Speculative Buy | $1.70 |
VCXVicinity Centres | Ord Minnett | Retained | Hold | $2.35(from $2.50) |
VEAViva Energy Group | Macquarie | Retained | Outperform | $3.75 |
| Morgan Stanley | Retained | Equal Weight | $3.10 | |
VNTVentia Services Group | Macquarie | Retained | Outperform | $5.90(from $6.60) |
| Morgan Stanley | Retained | Equal Weight | $6.40 | |
| Morgans | Retained | Hold | $4.95(from $5.95) |
Scans
Top Gainers
Code | Company | Last | % Chg |
|---|---|---|---|
| BUX | Buxton Resources Ltd | $0.023 | +35.29% |
| FTI | Fortifai Ltd | $0.32 | +30.61% |
| SFX | Sheffield Resources Ltd | $0.046 | +24.32% |
| EBR | EBR Systems Inc | $0.165 | +22.22% |
| ARN | Aldoro Resources Ltd | $0.51 | +20.00% |
Top Fallers
Code | Company | Last | % Chg |
|---|---|---|---|
| DTZ | DOTZ Nano Ltd | $0.011 | -21.43% |
| GED | Golden Deeps Ltd | $0.03 | -21.05% |
| VBS | Vectus Biosystems Ltd | $0.06 | -21.05% |
| AKG | Academies Australasia Group Ltd | $0.08 | -20.00% |
| PGD | Peregrine Gold Ltd | $0.105 | -19.23% |
52 Week Highs
Code | Company | Last | % Chg |
|---|---|---|---|
| ARN | Aldoro Resources Ltd | $0.51 | +20.00% |
| TML | Timah Resources Ltd | $0.05 | +6.38% |
| FNR | Far Northern Resources Ltd | $0.185 | +5.71% |
| EMB | Embelton Ltd | $12.88 | +4.72% |
| REH | Reece Ltd | $19.06 | +3.93% |
52 Week Lows
Code | Company | Last | % Chg |
|---|---|---|---|
| DTZ | DOTZ Nano Ltd | $0.011 | -21.43% |
| GED | Golden Deeps Ltd | $0.03 | -21.05% |
| VBS | Vectus Biosystems Ltd | $0.06 | -21.05% |
| FUL | Fulcrum Lithium Ltd | $0.05 | -16.67% |
| SNT | Syntara Ltd | $0.016 | -15.79% |
Near Highs
Code | Company | Last | % Chg |
|---|---|---|---|
| EXUS | Betashares Global Shares Ex US ETF | $38.15 | +1.60% |
| NDIA | Global X India Nifty 50 ETF | $65.17 | +1.97% |
| GLPR | iShares Ftse GBL Property Ex Aus (Aud Hedged) ETF | $28.35 | +1.65% |
| RHC | Ramsay Health Care Ltd | $55.94 | +0.81% |
| OZBD | Betashares Australian Composite Bond ETF | $43.46 | +0.23% |
Relative Strength Index (RSI) Oversold
Code | Company | Last | % Chg |
|---|---|---|---|
| VLS | Vita Life Sciences Ltd | $2.64 | 0.00% |
| FXG | FELIX Gold Ltd | $0.105 | +5.00% |
| SPL | Starpharma Holdings Ltd | $0.41 | -8.89% |
| IDX | Integral Diagnostics Ltd | $1.715 | -0.29% |
| VNT | Ventia Services Group Ltd | $4.99 | +3.96% |