
The ASX 200 edged higher despite a tech sell-off, as Alphabet’s historic earnings miss sent fresh cracks through the AI trade overnight. Defensives held firm for a second session, consumer discretionary stocks bounced, and miners and gold both fell.
Be sure to click/scroll through for the usual reporting of the major sector and stock-specific moves, the broker responses to them, as well as all the key economic data in tonight's Evening Wrap. Also, I have detailed technical analysis on the Nasdaq Composite and the S&P/ASX 200 in today's ChartWatch.
Let’s dive in!
Today in Review
Name | Value | % Chg |
|---|---|---|
Major Indices | ||
| ASX 200 | 8,908.1 | +0.18% |
| All Ords | 9,025.4 | +0.14% |
| Small Ords | 3,147.9 | -0.74% |
| All Tech | 2,818.8 | -0.76% |
| Emerging Companies | 2,735.3 | -1.07% |
Currency | ||
| AUD/USD | 0.703 | +0.02% |
US Futures | ||
| S&P 500 | 7,683.5 | -0.91% |
| Dow Jones | 52,460.0 | -0.10% |
| Nasdaq | 28,968.25 | -2.01% |
Name | Value | % Chg |
|---|---|---|
Sector | ||
| Consumer Discretionary | 3,683.7 | +2.73% |
| Industrials | 8,226.1 | +1.15% |
| Energy | 11,056.2 | +0.97% |
| Health Care | 34,777.8 | +0.84% |
| Communication Services | 1,588.1 | +0.79% |
| Utilities | 10,730.1 | +0.67% |
| Real Estate | 3,362.9 | +0.27% |
| Financials | 9,823.7 | +0.14% |
| Materials | 22,212.6 | -0.87% |
| Consumer Staples | 13,177.7 | -0.97% |
| Information Technology | 1,621.0 | -1.34% |
ASX 200 Intraday Chart
Markets
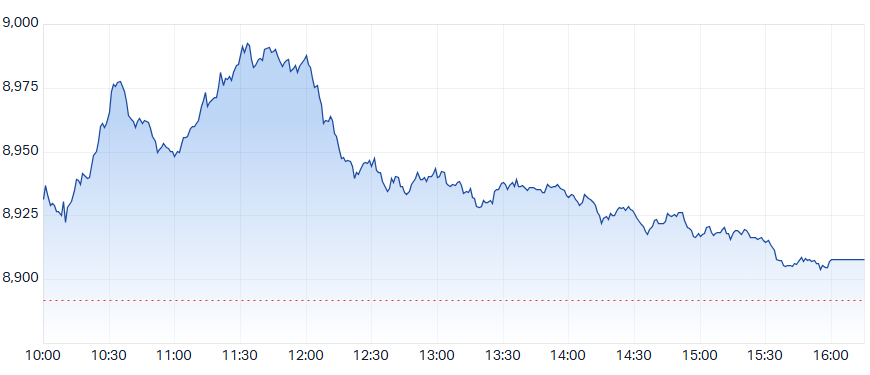
The S&P/ASX 200 (XJO) finished 16.3 points higher at 8,908.1, 0.95% from its session high and smack–bang on its session low. Despite the steady fade out in the benchmark, in the broader-based S&P/ASX 300 (XKO) advancers still managed to beat decliners by a modest 163 to 126
For the week, the XJO finished up 113 points or 1.3% higher, 2.1% from its intraweek low and 0.95% from its intraweek high (i.e., pullback from today’s intraday high!).
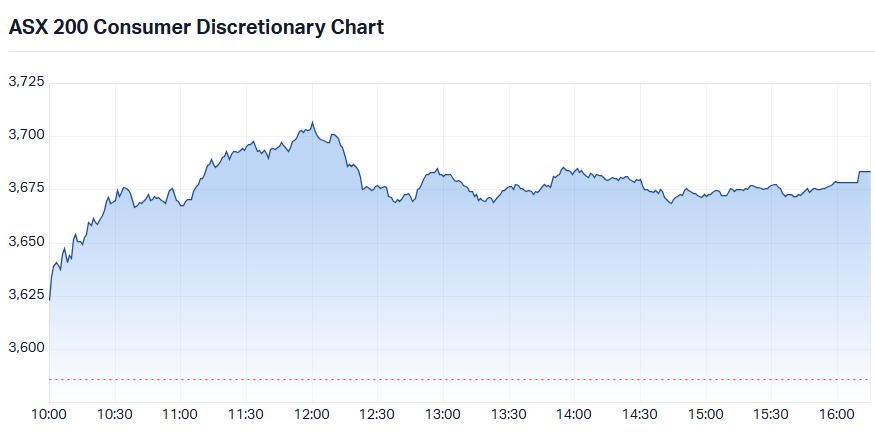
Consumer Discretionary (XDJ) (+2.7%) staged the session’s strongest rebound after a bruising week — part bargain hunting, part a practical reality of the Australian market: when Coles Group (COL) (-7.7%) fell as hard as it did, the cash it shook loose had to go somewhere! The larger-cap discretionary stalwarts were the primary beneficiaries as JB Hi-Fi (JBH) (+6.2%) led the charge, with Lovisa (LOV) (+4.3%) and Wesfarmers (WES) (+3.6%) also recovering strongly.
S&P/ASX 200 Consumer Discretionary Sector Index (XDJ) intraday chart
Energy (XEJ) (+1.0%) advanced for a second consecutive session as ICE benchmark Brent crude oil futures pushed +1.2% to US$112.11/bbl in Asian trade — touching a fresh cycle high of US$114.07 intraday before easing. Woodside Energy (WDS) (+1.8%), Karoon Energy (KAR) (+1.7%), Santos (STO) (+1.3%), and Beach Energy (BPT) (+1.1%) all firmed.
Uranium stocks, however, ran sharply in reverse — up close to 10% earlier in the week as the AI trade surged, they gave back roughly as much today as that trade soured. Deep Yellow (DYL) (-8.9%), Boss Energy (BOE) (-7.6%), Bannerman Energy (BMN) (-7.2%), and Paladin Energy (PDN) (-5.4%) all fell.
Health Care (XHJ) (+0.8%) extended Thursday’s defensive bounce. Sonic Healthcare (SHL) (+2.6%), Healius (HLS) (+2.1%), Australian Clinical Labs (ACL) (+1.9%), and CSL (CSL) (+1.6%) all advanced.
Communication Services (XTJ) (+0.8%) firmed across both its main cohorts. Online classifieds stocks Seek (SEK) (+1.3%) and REA Group (REA) (+1.3%) led the way, with super defensive telcos Telstra (TLS) (+0.8%) and TPG Telecom (TPG) (+0.8%) also contributing.
Utilities (XUJ) (+0.7%) continued the defensive theme. Origin Energy (ORG) (+0.8%) and APA Group (APA) (+0.5%) both rose.
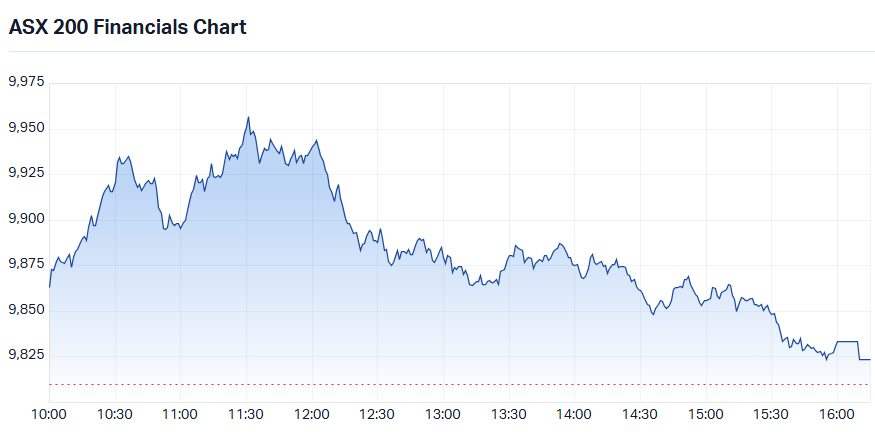
Financials (XFJ) (+0.1%) started the session with intent but faded as the day wore on — still a positive week for the sector overall. Insurers and fund managers did the heavy lifting today rather than the banks, with QBE Insurance (QBE) (+1.5%) and AMP (AMP) (+1.2%) the standout performers. Suncorp (SUN) (+0.6%) and Insurance Australia Group (IAG) (+0.6%) also gained.
S&P/ASX 200 Financials Sector Index (XFJ) intraday chart
Consumer Staples (XSJ) (-1.0%) was dragged lower almost entirely by Coles Group (COL) (-7.7%), whose weak sales update sent the stock into freefall before it found a floor. But consider: every other major constituent rose — Endeavour Group (EDV) (+4.3%), Treasury Wine Estates (TWE) (+4.0%), GrainCorp (GNC) (+2.6%), and Woolworths (WOW) (+1.9%) — likely beneficiaries of the cash Coles shook loose on the way down!
Blah, blah, blah, blah Carl... yeah, yeah defence was up today so that must mean... 🤦
The Gold Sub-Index (XGD) (-2.2%) fell as rising Brent crude flagged mounting energy cost pressures for miners — a theme that September quarter reports have been confirming one by one. COMEX benchmark gold futures slipped a further -0.4% to US$4,014.40/oz, the second consecutive session of declines. Pantoro Gold (PNR) (-5.3%), Genesis Minerals (GMD) (-3.7%), and Ramelius Resources (RMS) (-3.4%) led the selling.
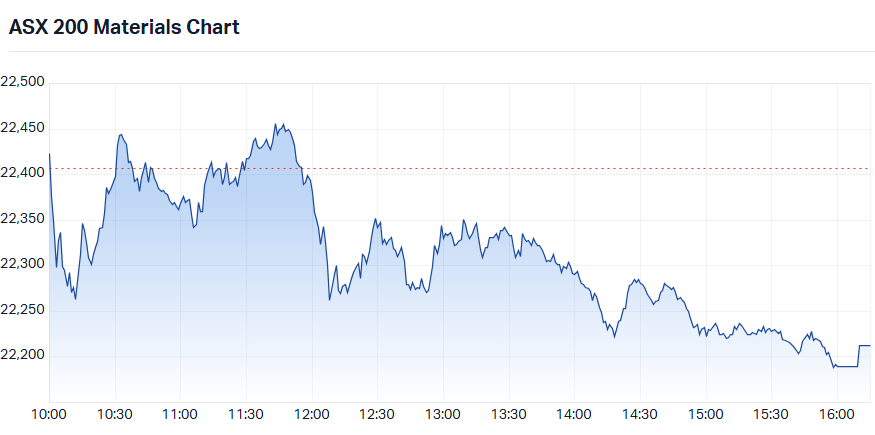
Materials (XMJ) (-0.9%) was pressured from multiple directions as the AI trade sell-off overnight pulled capital away from the critical minerals and copper plays investors had positioned as their local proxy for AI infrastructure spending. Base metals fell broadly on the London Metals Exchange overnight — aluminium -1.0%, copper -1.0%, nickel -1.4%, tin -2.5% — and rare earths prices extended their weekly decline, with NdPr down 1.6% over the week.
Rare earths and critical minerals stocks bore the sharpest selling: WA1 Resources (WA1) (-9.0%) and Lynas Rare Earths (LYC) (-7.1%) both fell sharply, with Arafura Rare Earths (ARU) (-3.2%) also lower. "You need copper for the AI revolution" stocks followed: Aurelia Metals (AMI) (-5.9%) and 29Metals (29M) (-5.6%) fell, while Rio Tinto (RIO) (-1.6%) was also weighed by a halt to underground operations at its Oyu Tolgoi copper mine.
S&P/ASX 200 Materials Sector Index (XMJ) intraday chart
Lithium stocks couldn’t catch a break either — GFEX lithium carbonate futures in China bounced +3.6% to CNY91,540/t, but it did nothing for local names, which remain in the grip of a brutal sector re-rating as investors come to terms with a halved lithium price and the prospect of a third bear market in under a decade. Liontown Resources (LTR) (-7.5%), Core Lithium (CXO) (-6.7%), Elevra Lithium (ELV) (-5.6%), IGO (IGO) (-5.1%), and Pilbara Minerals (PLS) (-4.0%) all fell. Fortescue (FMG) (-2.2%) also retreated.
Today's best ASX Top 300 gainers
Company | Last Price | Change $ | Change % | 1mo % | 1yr % |
|---|---|---|---|---|---|
| The Star Entertainment Group (SGR) | $0.155 | +$0.015 | +10.7% | +24.0% | +76.1% |
| Reece (REH) | $17.09 | +$1.33 | +8.4% | +1.6% | +41.6% |
| JB Hi-Fi (JBH) | $72.88 | +$4.26 | +6.2% | +8.6% | -32.8% |
| Turaco Gold (TCG) | $0.765 | +$0.035 | +4.8% | -10.0% | +68.1% |
| James Hardie Industries Plc (JHX) | $38.46 | +$1.60 | +4.3% | +6.4% | +17.1% |
| Endeavour Group (EDV) | $3.39 | +$0.14 | +4.3% | +12.6% | -7.4% |
| Civmec (CVL) | $1.70 | +$0.07 | +4.3% | +1.2% | +16.4% |
| Lovisa Holdings (LOV) | $26.20 | +$1.07 | +4.3% | +7.1% | -31.1% |
| Treasury Wine Estates (TWE) | $6.17 | +$0.24 | +4.0% | +14.3% | +1.8% |
| Pinnacle Investment Management Group (PNI) | $15.47 | +$0.56 | +3.8% | +10.8% | -23.0% |
| Wesfarmers (WES) | $76.69 | +$2.67 | +3.6% | +3.1% | -11.0% |
| Mader Group (MAD) | $5.68 | +$0.18 | +3.3% | -11.0% | -36.8% |
| EBOS Group (EBO) | $16.61 | +$0.52 | +3.2% | +7.2% | -34.5% |
| Ricegrowers (SGLLV) | $14.40 | +$0.39 | +2.8% | +18.4% | -16.9% |
| PEXA Group (PXA) | $7.03 | +$0.19 | +2.8% | +6.8% | -52.6% |
| Digico Infrastructure REIT (DGT) | $2.23 | +$0.06 | +2.8% | -9.3% | -14.9% |
| Liberty Financial Group (LFG) | $3.37 | +$0.09 | +2.7% | +5.3% | -17.4% |
| Sims (SGM) | $20.80 | +$0.54 | +2.7% | -13.5% | +30.9% |
| Sonic Healthcare (SHL) | $19.57 | +$0.50 | +2.6% | +4.4% | -7.0% |
| Graincorp (GNC) | $6.70 | +$0.17 | +2.6% | -1.2% | -23.7% |
Today's worst ASX Top 300 losers
Company | Last Price | Change $ | Change % | 1mo % | 1yr % |
|---|---|---|---|---|---|
| 4DMedical (4DX) | $2.44 | -$0.84 | -25.6% | -40.2% | +37.9% |
| Catalyst Metals (CYL) | $3.92 | -$1.29 | -24.8% | -33.2% | -41.7% |
| Kingsgate Consolidated (KCN) | $3.85 | -$0.56 | -12.7% | -23.2% | +9.7% |
| IperionX (IPX) | $2.15 | -$0.30 | -12.2% | -18.3% | -68.3% |
| Sunrise Energy Metals (SRL) | $11.80 | -$1.55 | -11.6% | -48.8% | +164.6% |
| Coles Group (COL) | $21.66 | -$1.80 | -7.7% | -7.1% | -2.0% |
| Liontown (LTR) | $0.62 | -$0.05 | -7.5% | -34.7% | -45.9% |
| Bannerman Energy (BMN) | $3.37 | -$0.26 | -7.2% | -5.1% | -6.9% |
| Lynas Rare Earths (LYC) | $12.10 | -$0.93 | -7.1% | -11.3% | -18.2% |
| DroneShield (DRO) | $1.37 | -$0.08 | -5.5% | -15.2% | -66.3% |
| Paladin Energy (PDN) | $7.47 | -$0.43 | -5.4% | -21.1% | -21.2% |
| Pantoro Gold (PNR) | $2.86 | -$0.16 | -5.3% | -5.6% | -42.5% |
| Electro Optic Systems Holdings (EOS) | $8.52 | -$0.47 | -5.2% | -23.8% | +30.7% |
| IGO (IGO) | $4.98 | -$0.27 | -5.1% | -24.4% | -9.9% |
| Minerals 260 (MI6) | $0.74 | -$0.04 | -5.1% | -17.8% | +169.1% |
| Benz Mining Corp (BNZ) | $4.19 | -$0.22 | -5.0% | -23.3% | +179.3% |
| NEXTDC (NXT) | $5.87 | -$0.30 | -4.9% | -45.7% | -62.5% |
| Silex Systems (SLX) | $3.33 | -$0.15 | -4.3% | -23.4% | -68.3% |
| Aura Consolidated Group, Inc. (AXQ) | $3.36 | -$0.15 | -4.3% | -12.0% | -50.9% |
| PLS Group (PLS) | $2.64 | -$0.11 | -4.0% | -31.8% | -20.0% |
Chartwatch
Nasdaq Composite Index
Nasdaq Composite Index chart
Analysis
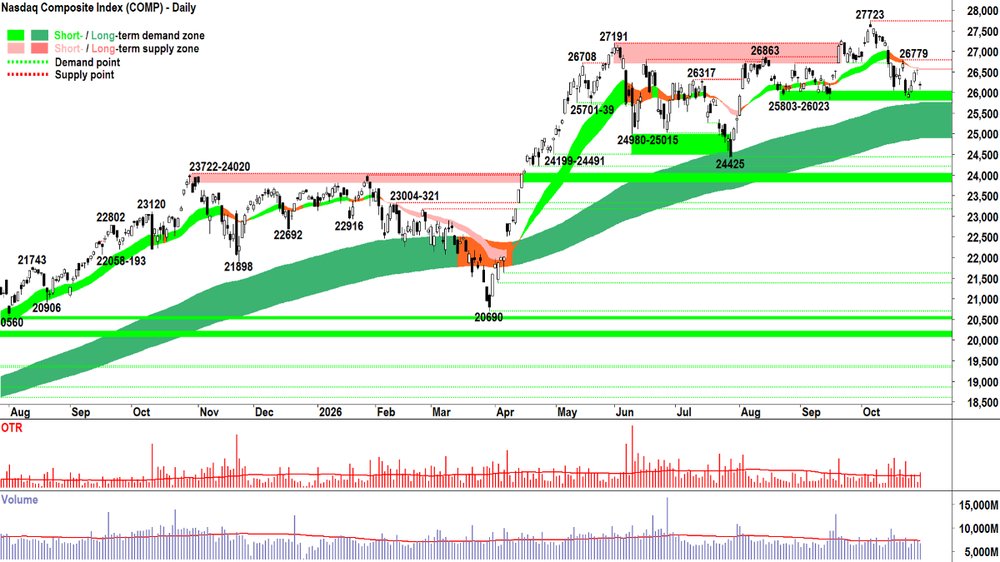
Of course, the short term trend ribbon didn't make the Comp go down last night. I know it kinda looks that way, price bounced from precisely within the 25803-26023 demand zone, to precisely the short term trend ribbon — where we as proponents of my technical model assume there will be dynamic latent supply — and fell back to the top of the demand zone, where it bounced a bit...
Pure coincidence.
And as much fun as it is to say: "See how the pretty coloured zones I drew on the chart weeks ago worked perfectly..."
It really is all BS.
I mean it!
All of technical analysis. All of fundamental analysis.
All BS.
If anything you did to try to predict the price of anything worked...
It happened by pure coincidence.
Because the future is unknown, and because the future is uncertain... 🔮
Rendering all forms of prediction utterly useless.
So, never confuse "good analysis" with "predictive prowess". The future somehow aligned with the stuff you said would happen, this time.
Next time. Well that's a whole other dice roll! 🎲🎲
And the market is the greatest teacher, and greatest humiliator, of anyone who believed for too long that they were in possession of "predictive prowess"!
But, having said all that... Yes, I'm on a bit of a roll of my own here...
It is comforting to know that one has model that does its job MOTN.
A model is simply a way to make sense of a complex system and assess what might happen next. Its value lies not in predicting the future, but in helping us make better decisions in the face of uncertainty.
I hope you agree, my model at least ticks that box!
Anyway, what does my model think about the complex system above called the Comp? It doesn't predict, remember, it only knows what has already transpired:
ST Trend = ⬇️ = ⚠️
= S > D from shorter term investors
ST Trend ribbon is behaving as a zone of dynamic supply (evidence of STR, NUTE, and FOHO in the short term)
LT Trend = ⬆️ = ✅
= D > S from longer term investors
LT Trend ribbon is behaving as a zone of dynamic demand (evidence of BTD, FOMO, and HOFU in the long term)
Price action = falling peaks and falling troughs 📉 = ⚠️
Falling peaks = Think: Why was the price unable to breach the last point of supply!? = STR, FOMO = 🚫, HOFU = 🚫, and evidence of supply reinforcement!
Falling troughs = Think: Why did the price drop through the last point of demand!? = NUTE, FOHO, and evidence of demand removal!
Candles = Mixed = ⚖️
Bit of a zebra situation here... 🦓 A few bad ones, then a few good ones... all over the shop isn't enough to warrant adding risk!
Volatility = Elevated vs a lack of coincident trends = ⚠️
All over the shop for little net change in price!
Volume = Generally below average = ⚖️
Not a great deal of conviction either way, a listless market!
Which gives us: ⚠️✅⚠️⚖️⚠️⚖️
That's our Analyse.
Now, there's a bunch of people out there trying to figure out what to do with their trading accounts, with the retirement portfolios, and even with the big trillion-dollar hedge funds...
Some are bulls, some are bears... many are just plain confused... 🤷
And yet, we have a model so simple here, that results in ZERO CONFUSION.
We Accept that when a market is ⚠️✅⚠️⚖️⚠️⚖️, MOTN the price goes sideways at best, but probably down a bit.
Any sensible person operating on logic must agree that when faced with such a scenario, it makes little sense to be fully invested — or as we call it, FRP.
So where should one be then!? How should one Act with respect to their risk in the market? 🤔
That's up to you, but as a sensible person operating on logic... 1/2RP... i.e., roughly balanced... seems like an appropriate place to me! ⚖️
Tomorrow's another day. It brings with it another candle. Our job as proponents of the model is to do the work again:
See if D or S has increased or decreased as per our technical indicators, i.e., Analyse
Then, based on the probabilities our analysis suggests, Accept the most likely outcome
And Act accordingly
With consistency and discipline until the last candle we get to see (which hopefully is many, many years away! 😉)
It can be this simple... or you can read the news and study balance sheets and P&L's. It don't make a lick of difference to me! Have a fantastic weekend everyone! 👋
View
I am 1/2RP on US stocks (RP = Risk Position – it reflects my personal allowable capital allocation limit for my investments in US stocks. So 1/2RP is 50%, 2/3RP is 67% and FRP is 100%).
Key Levels
26779 is the closest key point of supply, but the short term trend ribbon will also likely act as a dynamic zone of supply (presently 26558–26586). 25803-26023 is the closest key zone of demand.
S&P/ASX 200 (XJO)
S&P/ASX 200 (XJO) chart
Analysis
Comp down looked bad, but consider RUT up, MidCap 400 up... so really not that bad in terms of cues for the local bourse (these indices are less influenced by the big hyperscalers / AI trade in general).
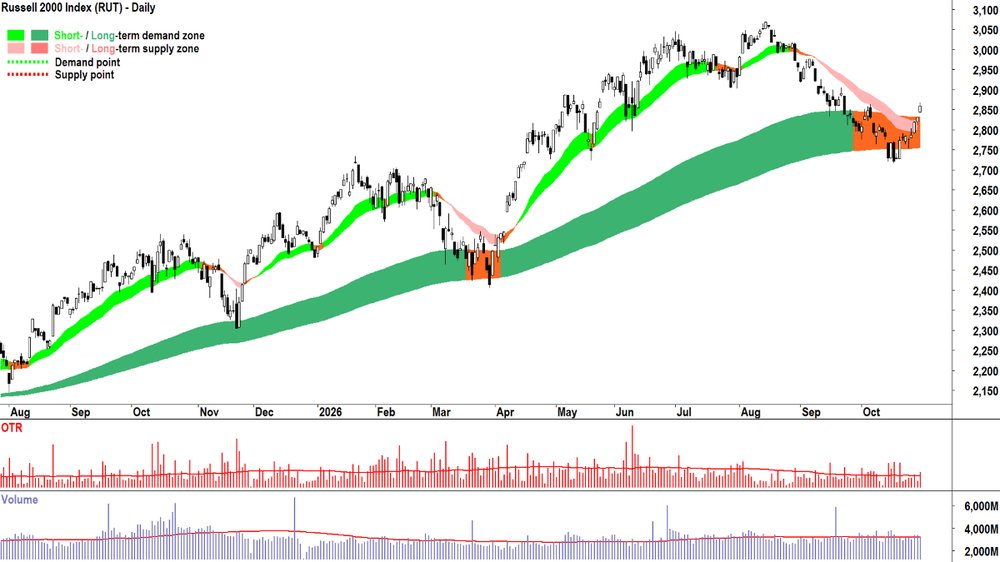
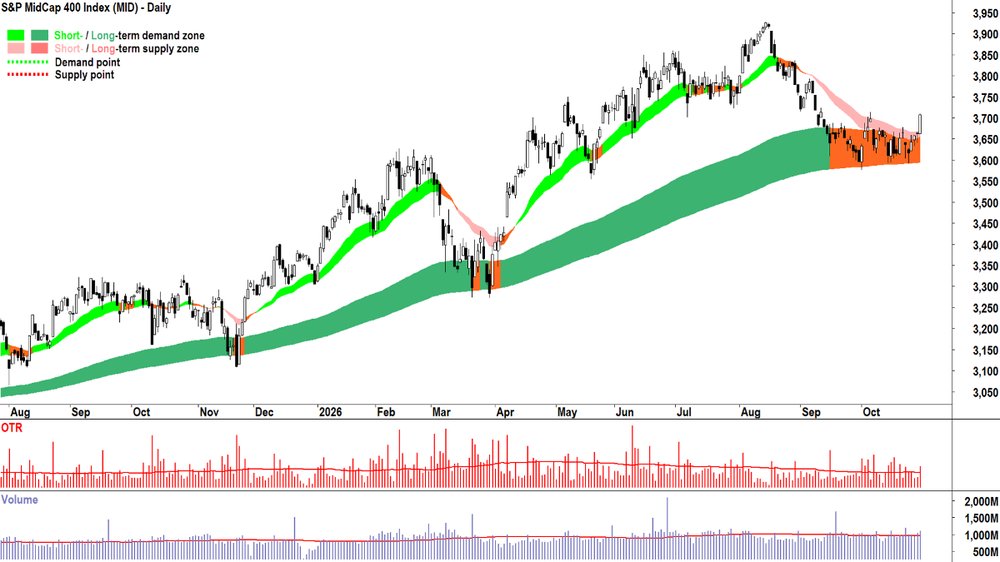
Russel 2000 (top), MidCap 400 (bottom)
We don't have any AI. Nothing really that's very interesting or exciting at all...
Which is a good thing if the exciting stuff is going down.
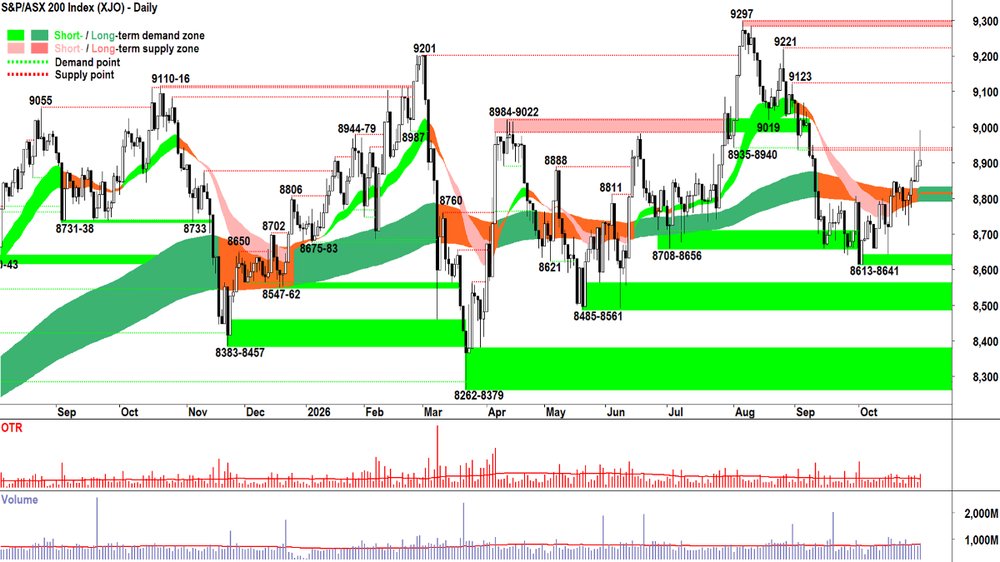
So, the OTP fared pretty well today. Hey, it could have been better, but all things considered — today's candle is sufficient to maintain our present view that the demand side remains in control of the short term price action.
Clearly, there's some pesky supply supply around, hence the glaring upward pointing shadow (I note the second in three sessions). But, it is Friday... there's weekend risk, and did either of us expect those early gains to hold today? 🤷
Let's simply commit to continue to monitor to see if those STR activities persist / grow. 🔍
But we're already at 1/2RP = perfectly balanced. So really, what's there left to do on a day like today!? ⚖️
View
I am 1/2RP on Australian shares (i.e., 50% cash vs 50% invested, with some of the invested portion allocated to shorts).
Key Levels
8935-8940 is the closest zone of supply vs 8613-8641 is the critical zone of demand.
(Glossary of acronyms! Old Tin Pot (OTP): S&P/ASX 200 | MOTN: More Often Than Not | FOMO: Fear Of Missing Out | HOFU: Holding On For Upside | BTD: Buy The Dip | NUTE: No Urgency To Enter | FOHO: Fear Of Holding On | STR: Sell The Rally | RP: Risk Position | FFS: Fund Flow Shenanigans!)
***CHARTWATCH LIVE IS BACK!!!***
ChartWatch LIVE Webinars – WEEKLY Wednesday's @ 12pm AEDT
Learn more about technical analysis and trend following through real case studies on ASX stocks. Australia's premier technical analyst, Carl Capolingua, shares his unique insights on stocks as requested by viewers. Ask about a company in your portfolio or anything related to trading and investing and get Carl's expert opinion.
Places are limited so >REGISTER NOW!<
Economy
TODAY
AUS September quarter Producer Price Index (PPI)
Result: +1.1% q/q vs +1.0% q/q forecast and +1.3% q/q in June quarter
Reader: Slightly hotter than forecast. Annualises at 4.4% p.a. and at 3.6% p.a. historical. This is wholesale inflation, and we generally view it as an indicator of what's in the pipeline for CPI — so another signal Aussie inflation is likely heading up, not down.
LATER THIS WEEK
SATURDAY
00:00 CHN October Purchasing Managers Index (PMI)
Manufacturing: 50.1 forecast, unchanged vs September
Non-Manufacturing: 50.5 forecast vs 50.2 in September
Interesting Movers
Trading higher
- Count (CUP) $1.66+23.5%
Announced a new equity partnership and issued a trading update. Revenue rose 23.2% to $52.1 million in the September quarter with underlying EBITA up 66.6% to $12.7 million. CUP is buying a 30% stake in Apiary.
- The Star Entertainment Group (SGR) $0.16+10.7%
No news. Continued positive response to yesterday's AUSTRAC civil penalty proceedings decision.
- Omega Oil & Gas (OMA) $0.83+9.9%
No news. Performance reflected general strength in the broader energy sector.
- Reece (REH) $17.09+8.4%
Issued a trading update at its AGM. Q1 sales A$2,510 million, up 4.3% y/y (up 8.7% constant currency); ANZ sales +12.8%, US sales +5.6% (like-for-like +2.4%). Management noted ANZ trading strong, but US soft, and it remains cautious on H2 FY27.
- JB Hi-Fi (JBH) $72.88+6.2%
No news. Performance reflected general strength in the broader consumer discretionary sector.
- Endeavour Group (EDV) $3.41+4.9%
Issued a trading update at its AGM. Total group sales up 2.8% to $3.18 billion for the 14 weeks to 4 October with retail sales up 3.0% driven by transaction growth at Dan Murphy’s.
- Civmec (CVL) $1.71+4.6%
Issued a trading update at its AGM. Revenue rose 70% to $324 million in the September quarter and net profit rose 75%. Order book ~ $1.4 billion.
- ResMed Inc. (RMD) $35.74+1.0%
Reported September quarter results. Revenue rose 6% to US$1.41 billion in the quarter. FY27 guidance unchanged.
Trading Lower
- DXN (DXN) $0.14-49.1%
Released its September quarter activities report. Contained within was an announcement that its first US AI customer intends to cancel an $8.8 million HPC contract (HPC = Artificial Intelligence High-Performance Computing) after a strategic shift, though ~$4.2 million for completed work is not disputed. Backlog was adjusted to ~$30.8 million.
- 4DMedical (4DX) $2.44-25.6%
No news. Continued negative response to Wednesday's quarterly update and trading update. 4DX is a regular in the ChartWatch ASX Scans Downtrends List. 📉
- Catalyst Metals (CYL) $3.92-24.8%
Released its September quarter activities report. Gold production fell 30% q/q to 22.2koz (21% miss vs estimates). FY27 production guidance 90–105koz well below prior 130–150koz, and production from two mines now deferred to FY28.
- Elsight (ELS) $1.81-21.3%
No news. Continued negative response to Wednesday's quarterly activities report and trading update. ELS is a regular in the ChartWatch ASX Scans Downtrends List. 📉
- Appen (APX) $1.06-21.3%
No news. Stunning reversal of yesterday's gains following its September quarter trading update! US tech stocks tumble overnight likely also not helping...
- Kingsgate Consolidated (KCN) $3.85-12.7%
Released its September quarter activity report. Production was 14,802 oz gold and 187,925 oz silver. Final dividend 10c per share payable 11 Nov 2026 declared. Management flagged "a slower than anticipated" start to FY27 due to adverse weather at Chatree. FY27 guidance 75–85koz gold, 650–750koz silver, AISC US$1,650–1,850/oz, and sustaining capital ~ $300 million.
- Vulcan Energy Resources (VUL) $1.15-12.6%
Released its September quarter activities report. Lionheart lithium/geothermal project on schedule and on budget and well test ~64 L/s (60% above field development plan assumption).
- Coles Group (COL) $21.69-7.5%
Issued a September quarter trading update. September quarter trading update warned price investment, competitor promotions and higher fuel costs will leave H1FY27 Supermarkets EBIT flat at ~ $1.23 billion (~7% below consensus estimates), implying a downgrade.
- Emerald Resources NL (EMR) $6.03-3.5%
Released its September quarter activities report. Okvau processed lower-grade ore, leading to gold production down 25% q/q to 20.3koz. AISC rose 48% q/q to US$1,210/oz. Unchanged FY27 guidance.
- Rio Tinto (RIO) $147.13-1.7%
Paused underground operations at Oyu Tolgoi after seismic activity caused ground vibration. Three employees have been injured and border delays have cut truck availability for concentrate shipments.
- Capstone Copper Corp. (CSC) $11.89-1.1%
Reported September quarter results. Recorded a record September quarter with revenue up 19% to US$712 million and adjusted EBITDA up 44% to a record US$358 million.
- Helia Group (HLI) $5.41-0.1%
Issued a September quarter trading update. Year to date gross written premium fell 53% to $82.5 million (includes loss of CBA contract). YTD net profit down 32% to $136.5 million and higher arrears/claims amid a slowing housing market.
Broker Moves
Company | Broker | Action | Rating | Price Target |
|---|---|---|---|---|
ACLAustralian Clinical Labs | Ord Minnett | Retained | Hold | $3.00(from $2.60) |
AISAeris Resources | Canaccord Genuity | Retained | Buy | $0.75 |
| Ord Minnett | Retained | Buy | $0.83(from $0.80) | |
ALXAtlas Arteria | UBS | Retained | Neutral | $3.70(from $4.50) |
ARFArena REIT | Ord Minnett | Downgraded | Hold(from Accumulate) | $2.50 |
AUEAurum Resource | Bell Potter | Retained | Speculative Buy | $1.45 |
BETBetmakers Technology Group | Ord Minnett | Retained | Hold | $0.24 |
BHPBHP Group | Morgans | Upgraded | Hold(from Trim) | $57.90(from $55.30) |
BMNBannerman Energy | Canaccord Genuity | Retained | Speculative Buy | $5.40(from $5.80) |
BUBBubs Australia | Bell Potter | Retained | Speculative Buy | $0.12(from $0.19) |
| Ord Minnett | Retained | Accumulate | $0.12 | |
CBECobre | Canaccord Genuity | Retained | Buy | $0.50 |
CIAChampion Iron | Bell Potter | Retained | Hold | $2.20(from $2.50) |
CMMCapricorn Metals | Macquarie | Retained | Neutral | $14.70 |
| UBS | Retained | Buy | $24.00 | |
CSLCSL | UBS | Retained | Buy | $225.00(from $181.00) |
DEVDevEx Resources | Bell Potter | Retained | Speculative Buy | $0.40(from $0.41) |
DVPDevelop Global | Bell Potter | Retained | Buy | $5.40 |
| Canaccord Genuity | Retained | Speculative Buy | $6.40(from $6.70) | |
EDVEndeavour Group | Citi | Retained | Buy | $3.89 |
ELSElsight | Bell Potter | Retained | Buy | $5.30(from $8.20) |
FLCFluence Corporation | Bell Potter | Retained | Speculative Buy | $0.10(from $0.11) |
FRWFreightways Group | Ord Minnett | Upgraded | Buy(from Accumulate) | $12.11(from $13.02) |
GLCGlencore plc | UBS | Retained | Buy | $13.10(from $13.40) |
IDXIntegral Diagnostics | Bell Potter | Retained | Buy | $2.70(from $3.15) |
| Macquarie | Retained | Outperform | $2.80(from $3.35) | |
| Morgan Stanley | Retained | Overweight | $3.00(from $3.70) | |
| Ord Minnett | Retained | Buy | $2.70(from $3.30) | |
IGOIGO | Macquarie | Retained | Outperform | $7.00(from $9.00) |
JBHJB Hi-Fi | Macquarie | Retained | Outperform | $87.00 |
| Morgan Stanley | Retained | Underweight | $62.30 | |
| Morgans | Retained | Accumulate | $80.30(from $82.00) | |
| Ord Minnett | Retained | Hold | $73.00 | |
| UBS | Retained | Neutral | $70.00(from $72.00) | |
LTRLiontown | Bell Potter | Retained | Buy | $1.50(from $1.60) |
| Canaccord Genuity | Retained | Buy | $1.25(from $1.65) | |
| Macquarie | Retained | Outperform | $0.75(from $1.20) | |
| Morgans | Retained | Accumulate | $0.82(from $0.85) | |
| UBS | Retained | Buy | $1.20 | |
LYCLynas Rare Earths | Canaccord Genuity | Retained | Buy | $20.50(from $23.00) |
| Ord Minnett | Downgraded | Hold(from Accumulate) | $13.50(from $14.00) | |
| UBS | Retained | Buy | $21.00 | |
MMIMetro Mining | Ord Minnett | Retained | Buy | $1.75 |
NICNickel Industries | Canaccord Genuity | Retained | Buy | $1.10 |
NWSNews Corporation | UBS | Retained | Buy | $58.00 |
PNIPinnacle Investment Management Group | UBS | Retained | Buy | $17.85(from $17.00) |
QRIQualitas Real Estate Income Fund | Citi | Retained | Buy | $1.60 |
REHReece | Citi | Retained | Sell | $16.10 |
| Macquarie | Retained | Underperform | $15.20 | |
RIORio Tinto | Morgans | Upgraded | Accumulate(from Hold) | $169.00(from $162.00) |
RMDResMed Inc. | Citi | Retained | Neutral | $34.00 |
RSGResolute Mining | Canaccord Genuity | Retained | Buy | $2.45(from $2.35) |
| Macquarie | Retained | Neutral | $1.20(from $1.25) | |
SGIStealth Group Holdings | Morgans | Initiated | Buy | $1.85 |
SHASHAPE Australia Corporation | Morgans | Retained | Buy | $9.06(from $8.76) |
STXStrike Energy | Macquarie | Retained | Outperform | $0.17 |
SULSuper Retail Group | Macquarie | Retained | Neutral | $13.30(from $15.25) |
| Morgan Stanley | Retained | Underweight | $11.90 | |
| Morgans | Retained | Hold | $13.20(from $15.20) | |
| UBS | Retained | Neutral | $13.50(from $14.25) | |
SUNSuncorp Group | Citi | Retained | Neutral | $19.75(from $19.80) |
| Morgans | Retained | Hold | $20.13(from $20.00) | |
| Ord Minnett | Retained | Hold | $19.10 | |
| UBS | Retained | Buy | $21.80(from $21.25) | |
TTTTitomic | Ord Minnett | Upgraded | Accumulate(from Hold) | $0.16 |
TUATuas | Morgan Stanley | Retained | Overweight | $3.70(from $4.35) |
VULVulcan Energy Resources | Canaccord Genuity | Retained | Speculative Buy | $10.00 |
WESWesfarmers | Macquarie | Retained | Outperform | $81.00 |
| Morgans | Retained | Accumulate | $82.50(from $85.00) | |
| Ord Minnett | Retained | Buy | $88.00(from $89.00) | |
| UBS | Retained | Neutral | $77.00(from $82.00) |
Scans
Top Gainers
Code | Company | Last | % Chg |
|---|---|---|---|
| BTN | Butn Ltd | $0.011 | +57.14% |
| T3D | 333D Ltd | $0.035 | +40.00% |
| CUP | Count Ltd | $1.655 | +23.51% |
| ABE | Australian Bond Exchange Holdings Ltd | $0.035 | +20.69% |
| LNQ | LINQ Minerals Ltd | $0.555 | +20.65% |
Top Fallers
Code | Company | Last | % Chg |
|---|---|---|---|
| DXN | DXN Ltd | $0.14 | -47.17% |
| DAI | Decidr Ai Industries Ltd | $0.21 | -26.32% |
| 4DX | 4DMEDICAL Ltd | $2.44 | -25.61% |
| CYL | Catalyst Metals Ltd | $3.92 | -24.76% |
| ELS | Elsight Ltd | $1.81 | -21.30% |
52 Week Highs
Code | Company | Last | % Chg |
|---|---|---|---|
| CUP | Count Ltd | $1.655 | +23.51% |
| GW1 | Greenwing Resources Ltd | $0.12 | +9.09% |
| WCNDE | White Cliff Minerals Ltd | $0.50 | +6.38% |
| TWE | Treasury Wine Estates Ltd | $6.17 | +4.05% |
| FUEL | Betashares Global Energy Comp Currency Hedged ETF | $9.79 | +2.62% |
52 Week Lows
Code | Company | Last | % Chg |
|---|---|---|---|
| CYL | Catalyst Metals Ltd | $3.92 | -24.76% |
| LAC | LAC Gold Ltd | $0.22 | -18.52% |
| RCM | Rapid Critical Metals Ltd | $0.02 | -18.37% |
| CYM | Cyprium Metals Ltd | $0.30 | -17.81% |
| GNM | Great Northern Minerals Ltd | $0.02 | -16.67% |
Near Highs
Code | Company | Last | % Chg |
|---|---|---|---|
| BEAR | Betashares Australian Equities Bear Complex ETF | $7.40 | -0.27% |
| RHC | Ramsay Health Care Ltd | $55.60 | +1.24% |
| OZBD | Betashares Australian Composite Bond ETF | $43.26 | +0.37% |
| AN3PI | Australia and New Zealand Banking Group Ltd | $102.65 | -0.01% |
| PCI | Perpetual Credit Income Trust | $1.075 | +1.42% |
Relative Strength Index (RSI) Oversold
Code | Company | Last | % Chg |
|---|---|---|---|
| ETPMPM | Global X Metal Securities Australia Ltd | $336.79 | -1.66% |
| GLDN | iShares Physical Gold ETF | $45.04 | -0.84% |
| BHM | Broken Hill Mines Ltd | $0.465 | -1.06% |
| MRT | Maritana Minerals Ltd | $0.52 | -6.31% |
| LSGE | Loomis Sayles Global Equity Fund - Active ETF | $1.855 | -2.11% |