
Chalice landed a deal with Mitsubishi – So why did the stock sell off 20%?
Thu 04 Jul 24, 11:30am (AEST)

It’s time for the next instalment of my ASX seasonality series. Our last check-up was back in April as we were closing in on the infamous month of May – arguably the second worst month of the year for investors (September is typically the worst).
The data suggested that weak Aprils tended to yield weak May-June periods. This wasn’t strictly the case this year, because a strong rally in the first half of May more than made up for subsequent weakness (along with plenty of choppiness) in the back half of May and most of June. So, as bad as the last couple of months felt, you could say we dodged a bullet.
But I have good news Aussie investors: We’re about to enter the best-performing and most reliable two-month period in July and August. In fact, July is the most reliable month of the year for Aussie share investing, yielding a 100% winning strike rate over the last 10 years.
A quick reminder here about some of the parameters used in my seasonal analysis of Australian shares. I have been carefully collating data manually at the end of each month for the last 15 years or so for the All Ordinaries Total Return Index (XAOA), going back to 1982.
I prefer to use the All Ordinaries index over the typical S&P/ASX 200 (XJO) benchmark because it contains approximately 500 of the ASX’s largest companies compared to the XJO’s 200. Also, when doing any seasonal analysis of stocks, it’s vital that one considers total return – that is both capital gains and dividends.
Anything else is completely misleading as it will understate an index’s returns. For ASX seasonal analysis, it will particularly understate the performance in major dividend-paying months like March and August. I can assure you – you won’t find seasonal data as robust as that I maintain anywhere else!

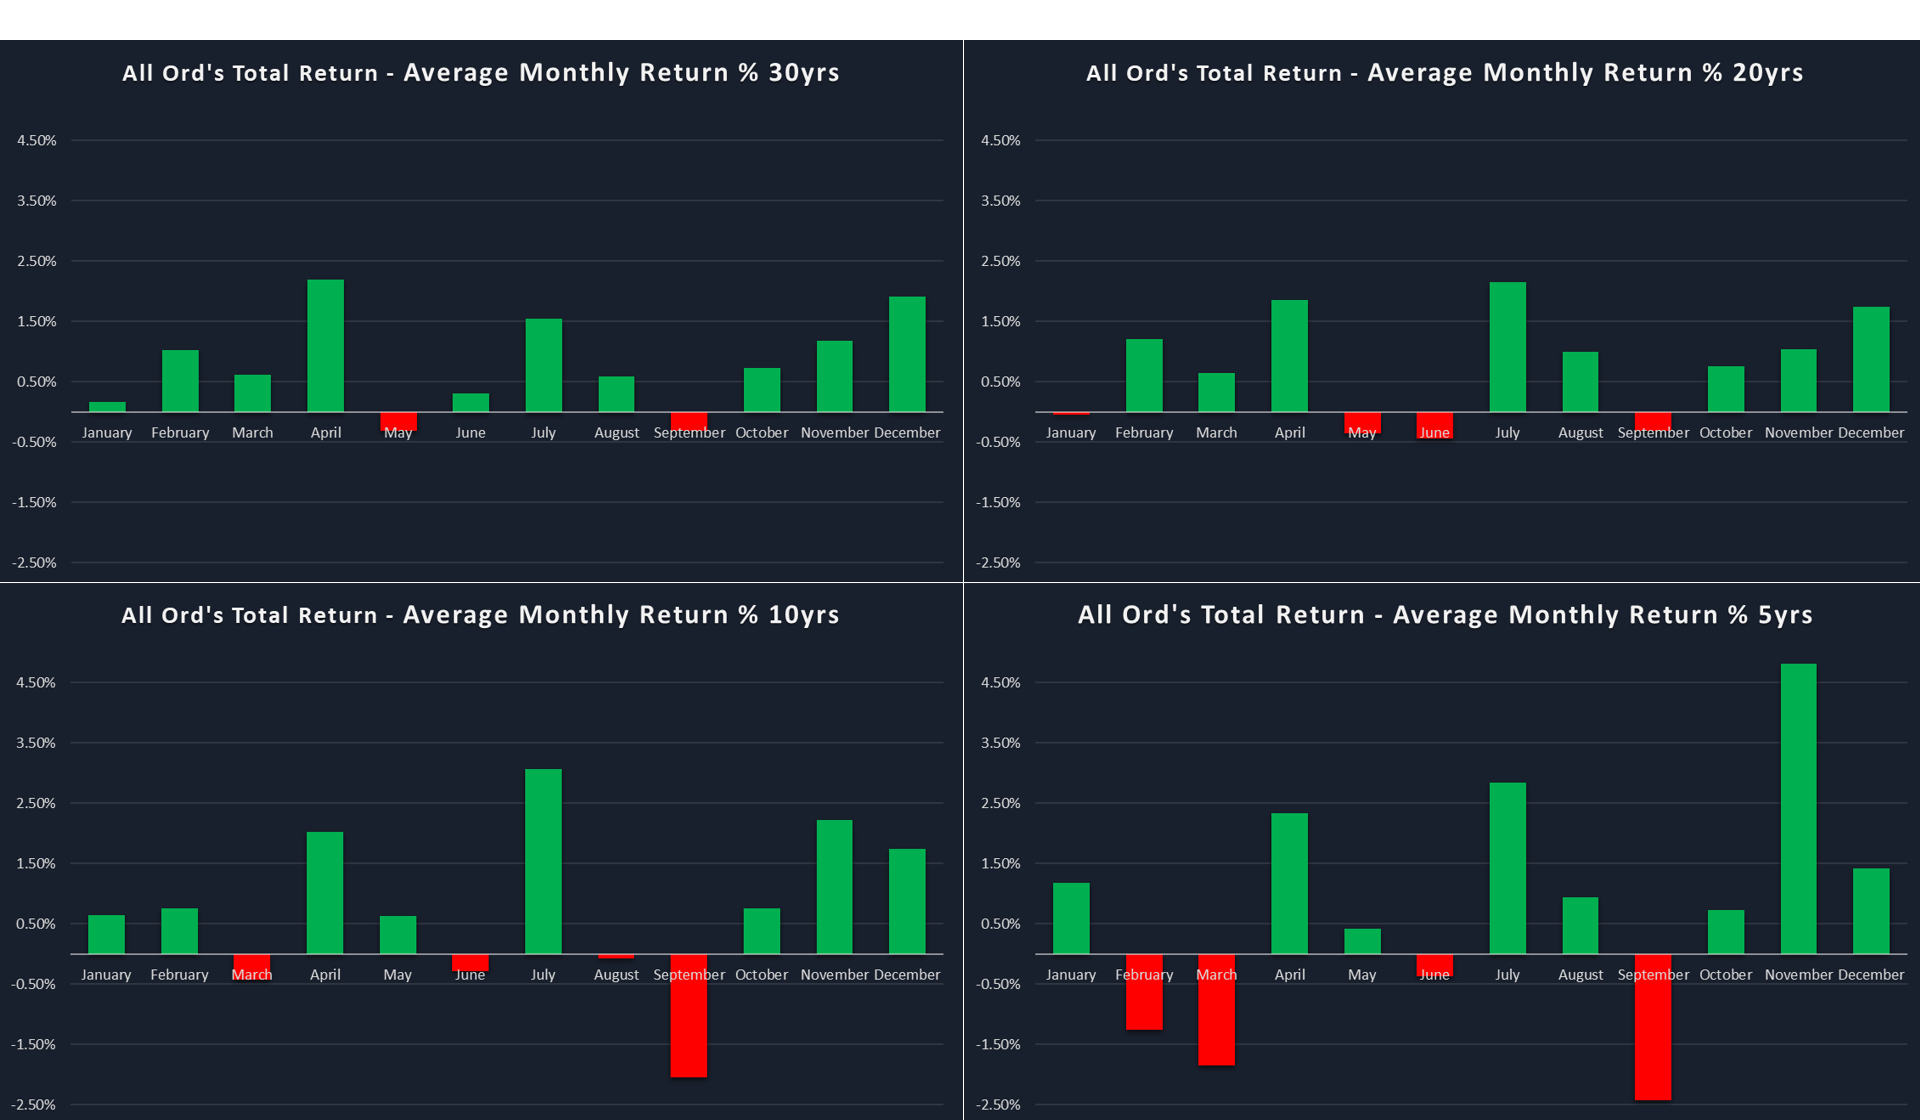
The chart set above is fantastic because it shows you the whole-year seasonal performance of the XAOA over 5, 10, 20, and 30-year lookback periods. I like to use a range of lookback periods as this provides insight into how seasonal trends might be changing over time.
Keep in mind though:
1. You can go back too far: Whilst longer lookback periods may provide a sense of robustness, seasonal trends do change over time and these changes may not be reflected in longer lookback periods
2. Short term trends are more likely to be influenced by outliers: For example, the 10-year August return is negative – but this is a result of a massive -7.8% decline in 2015 (i.e., 9-years ago). Remove this outlier, and the 10-year return for August is +0.2%)
For this reason, I prefer the 20-year lookback period as my key decision-making period, because it’s not too long and not too short!
As you can see from the charts above, May-June is mediocre at best, and July-August is generally positive – and over 20-years, it’s actually the best 2-month performing period of the year.
The 10-year lookback period shows the impact of the August 2015 “outlier”, but I note two other 5%-plus declines in 1997 and 1998 that could support the argument that August may occasionally share in September’s dodginess.

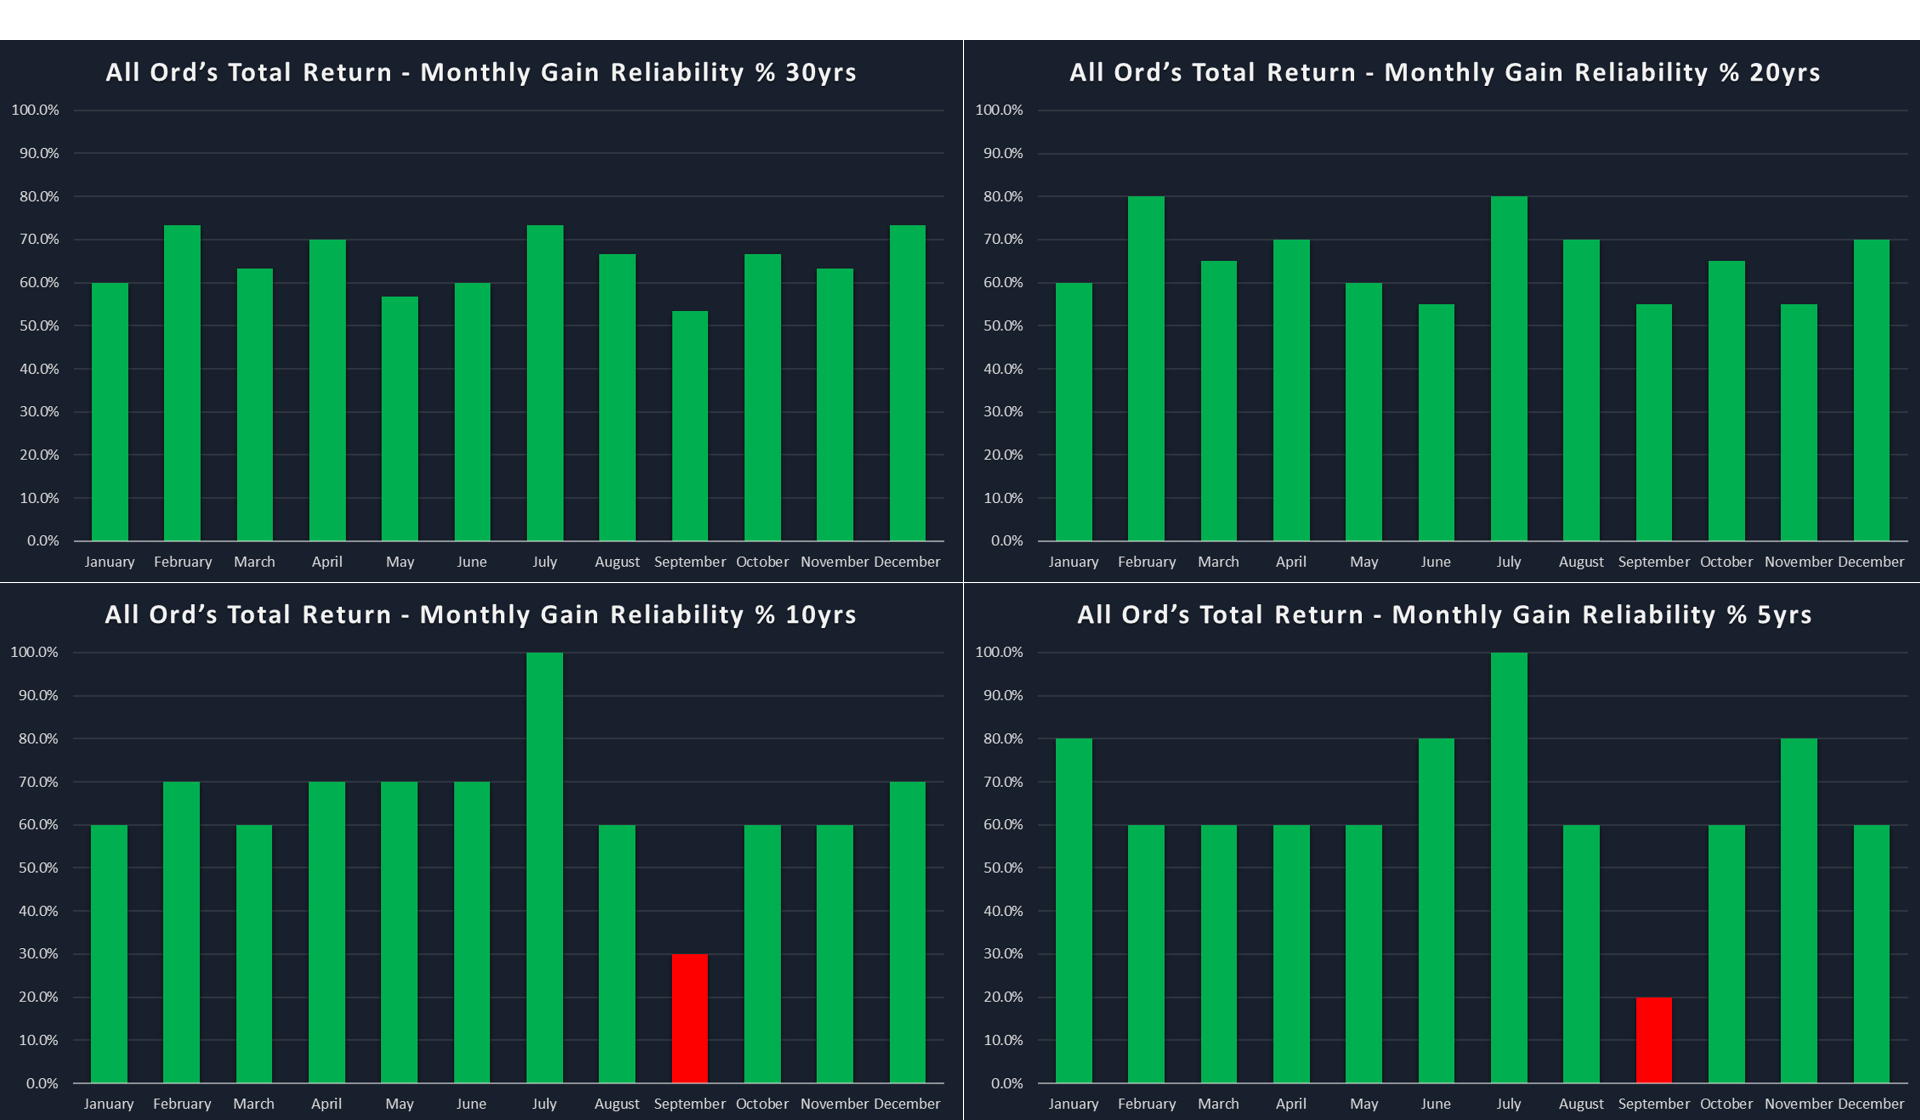
I suggest reliability, that is, the percentage of months that delivered a positive return in the sample, is also an important consideration. Note in the chart set above, the reliability for each month of the year over the selected lookback periods.
Looking at the performance and reliability chart sets, it is clear that July has been a relatively rock-solid month for Aussie investors. It rivals April, November, and December (the last two equal the Santa Claus Rally) for best month’s performance and is arguably the most reliable month of the year.
Focusing on my preferred 20-year lookback period, I note July’s superior 2.15% average return and 80% gain reliability. Over the last ten years, its outperformance of the other months is even more stark, and note its perfect record of gains. For your reference, find below a chart showing the performance of all Julys since 1982.

August clearly isn’t as good as July, but its average return over the last 20 years of 1.0% with a reliability of 70% is still solid enough – particularly when you consider it as an extension of July’s gains. Again, for your reference, find below a chart showing the performance of all Augusts since 1982.

Ok, I think I’ve made my point: July and August are typically very strong and reliable months for Aussie shares.
But! Can we sharpen our seasonality pencils a little? Is there a pattern that might indicate that certain July-August periods tend to be stronger than others?
Let’s check to see if the performance of the XAOA in the first half of the year impacts July-August. For example, does July-August performance improve or deteriorate depending on whether the first half’s performance was positive or negative?
The data shows July-August periods are so good that they deliver a positive return on average regardless of whether the first half is up or down. But, interestingly, winning first halves do tend to see better July-August performances.

So far in 2024, the XAOA is up 4.2% to June 30. This is modestly better than the average first-half performance over the last 20 years of +3.1%. One could, therefore, easily conclude from the data that this July-August has just as good a chance of delivering a strong return for Aussie shares as any other.
And that brings us to my usual sign off in my seasonal articles! This is the bit where I remind you that seasonality is just a guide to what might happen. The future is unknown, and even if something happened 99 times out of 100 in a particular market, there’s no guarantee it will happen next time.
However, I do believe seasonal analysis can provide us with greater confidence to pursue a certain strategy when we see the market is behaving in line with well-entrenched seasonal patterns. Certainly, I’d want to know if we’re about to kick off a period of seasonal strength just like the one we’re about to enter now.
Get the latest news and insights direct to your inbox