
Evening Wrap: ASX 200's weekend woes far less painful considering melt-up in lithium, critical metals stocks
Fri 17 May 24, 5:36pm (AEST)

While inflation remains above target in most major economies, investors have been turning to other hedges beyond bonds and cash. Some use alternatives like private equity while others use investments in raw commodities such as gold and oil futures. Commodity prices typically rise when inflation is accelerating - you may have seen this chart from AcreTrader which shows the returns of timber investments during periods of high inflation.

The point here is that commodities are one of the few asset classes which benefit from rising inflation, particularly unexpected inflation.
But that hedge may be about to come undone. In this piece, we’ll explain why and what it means for any potential investments.
A key market metric, which is a correlation between the S&P 500 and the Bloomberg Commodity Index, has reached levels not seen for over 40 years. Put simply, the chart suggests that a greater-than-zero correlation implies that stocks and commodities are moving very closely in tandem.
The stocks story is, as every investor and their dog knows by now, is driven by the returns in mega-cap tech stocks. But the commodities story is being driven by governments and central banks, who are buying a lot of gold to hedge against ongoing geopolitical uncertainty.
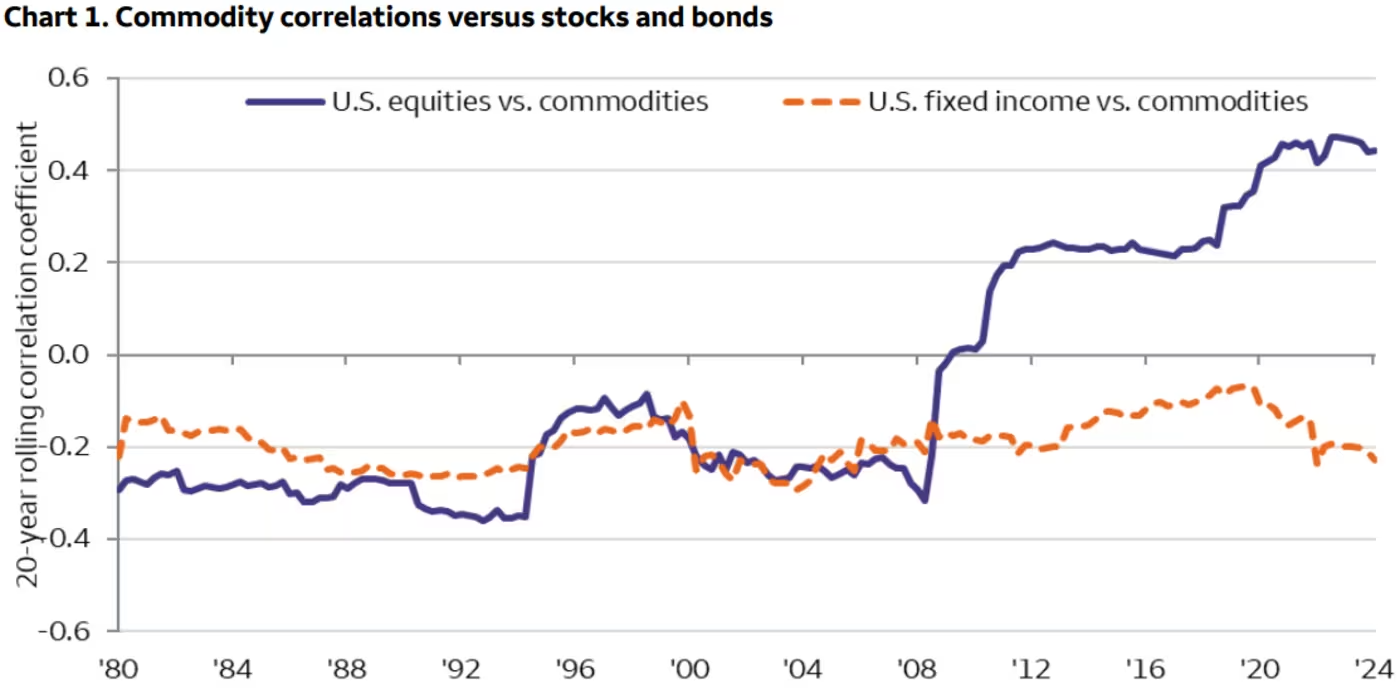
For most of the period until the GFC’s breakout, commodity markets have moved inversely with stock markets. That is, a commodity bull market would be occurring in tandem with a bear market in stocks. But that has slowly but surely changed.
In short, two main outcomes are possible. Firstly, the positive correlation means that if there were to be a downturn in either market, both could move together. This essentially cancels out the effect that commodities are meant to serve as a hedge in portfolios.
Secondly, and perhaps more importantly, the correlation may suggest that a looming supercycle for commodities is very real.
The latest commodity bear supercycle started during the financial crisis and extended until 2020, when the rolling 20-year commodity-stock correlation increased from negative 0.3 to 0.4. During that time, gold prices more than doubled and iron ore prices went from $65/tonne to $173/tonne. But, as you may have guessed, not all commodities move in a straight line. The uranium bull market was quiet for more than a decade and crude oil prices actually more than halved between January 2008 and December 2020.
Wells Fargo Investment Institute, who put out this research, argues that any weakness in commodity markets should be bought given they believe we are in the middle of a supercycle. At the end of last year, they predicted gold prices would hit US$2,200/ounce this year (a figure that has already passed).

“We remain bullish on commodities, and likely will for a few more years,” Wells Fargo strategists wrote recently.
“Historically, it has been common for commodity prices to take breathers during bulls. Our take is that the bull will likely resume sometime in 2024. We believe this because the underlying driver of commodity bulls, lack of supply growth relative to demand growth, remains intact. And we do not expect to see this balance changing anytime soon,” they added.
It’s not just Wells Fargo who feel this way. Among the other major brokers that we at Livewire and Market Index eye, Macquarie recently spotlighted three small cap lithium miners as ones that could outperform. Citi thinks copper prices will hit US$10,500 in the near term. And UBS believes we could see US$2,500/ounce gold sometime this year, arguing the traditional relationship between gold and real yields is “not broken forever”.
Among the fund managers, MPC Markets’ Mark Gardner has argued that a slew of macro tailwinds has allowed him to buy stocks such as BHP, Newmont, and Incitec Pivot (as well as copper and uranium ETFs for the energy transition).
Meanwhile, on the most recent episode of Livewire’s Signal or Noise, Janus Henderson Investors’ Daniel Sullivan argued that we are in a “once in a generation” buying opportunity for gold and gold stocks. He also said that uranium investors should not give up on a bull market they have been waiting years for.
Get the latest news and insights direct to your inbox