Hi there!
What a week – let’s try to wrap our heads around what happened (brace yourself for a long intro).
China chip progress (Sun): Chinese chipmaker CXMT announced “key progress” on a new DRAM cell architecture that could lift memory density by 30-50%. This tanked the Philadelphia Semis Index by 2.6% on Monday.
CoreWeave (Wed): The yield on its longer-dated corporate bonds spiked to 15%, pushing them into distressed territory. Lenders are losing confidence in the company’s debt-fuelled expansion. The stock fell 15.5% on Wednesday.
US CPI (Wed night): Core inflation rose 2.6% year-on-year in September vs. 2.5% ests. Higher diesel prices are increasingly flowing through into services, and services ex-energy is accelerating, up 0.4% month-on-month. What we’re really seeing is widespread, moderate price pressure.
Aus employment (Thu): The unemployment rate held at 4.7% in September vs. 4.6% ests, while employment fell by 39,300 vs. ests of a 20,000 gain. This sent the policy-sensitive Aussie 3-year yield down 11 bps to 4.81%, a fresh 5-week low.
Thursday marked one of the wildest sessions on the ASX 200. The index closed down just 8 pts (-0.09%) after clawing back an early 87 pt (-0.99%) drop. But look at how sectors performed: Staples (+3.4%), financials (+2.1%), utilities (+2.0%) and telcos (+1.5%) rallied, while tech (-3.4%) and materials (-3.9%) sold off. What a dispersion. Index holders got a regular dinner, defensives had lobster and resources/tech got two-minute noodles.
So there’s been plenty of chatter about how solid markets and high yields can co-exist, as long as earnings growth holds up. But we're starting to see parts of that equation shift (for better or worse).
The AI trade is showing cracks. The KOSPI has dropped 18% in the last seven sessions.
The stakes are as high as ever. Micron and Nvidia are expected to account for 36% of the S&P 500’s forecast Q3 earnings growth of 27.2%. Yes, two stocks make up just over a third of the growth.
Bond yields are starting to roll over, which is a good thing. But it’s not because inflation is falling (US core CPI is as stubborn as ever and Brent is still at US$105), but the economy is starting to slip
That’s why we’re seeing a pretty dramatic pivot into the classic defensives like staples, banks and utilities, while miners, which have become somewhat correlated to the AI trade, buckle. Local tech, which is mostly software and has very little to do with AI, seems to have caught on and rallied more than 5% on Friday.
Anyway, let's dive in.
Investor sentiment survey
.png)
Bears retreated from last week's 50.6%, but remain firmly elevated at the 82nd percentile.
This is now six consecutive net-bearish weeks, with bearishness above 40% in every one. It's the longest sustained pessimism in the ~73 weeks we've been running the survey.
Over the next three months, do you expect the Australian stock market to be:
A stealth bear market
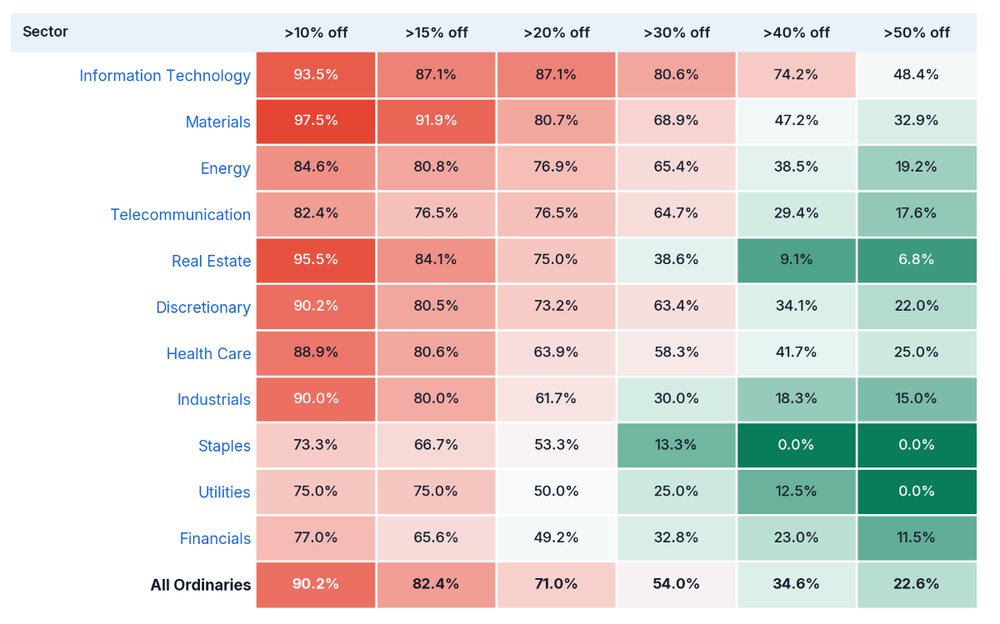
The ASX is trading around breakeven year-to-date, but I'm sure many of us feel absolutely battered in recent days or weeks.
The chart above shows the share of All Ords constituents in each sector trading below their 52-week highs, as at the close on Thursday, 15 October. It's not a good look!
A few key numbers to think about:
71% of All Ords stocks are more than 20% below their 52-week high, but they make up only 30% of market cap
The median stock is down 12.5% over the past 12 months, vs a cap-weighted return of 3.9%
Stocks under $300m are hardest hit, with 91% more than 20% off their highs, vs 27% for large caps over $10bn
Financials lead the 19 stocks within 5% of their 52-week highs, with seven names including Suncorp, IAG and QBE, alongside Woolworths, Coles and APA
The median energy and materials stock fell 12-13% over the past month, while the median staples and utilities stocks rose 3.2% and 1.0%
Hello Glencore!
Glencore (GLC) made its ASX debut at 11 am AEDT on Wednesday. It wasn’t an IPO in a capital-raising sense, as no new shares were issued, just the listing of its CDIs. By the end of the first day, Australian CDIs made up about 0.5% of the total register, according to the AFR.
While Glencore has a market cap of roughly A$150 billion, its ASX market cap only counts shares held on the Australian register. As local ownership builds, Canaccord Genuity reckons ASX 200 inclusion could come as soon as March, bringing buying from passive funds.
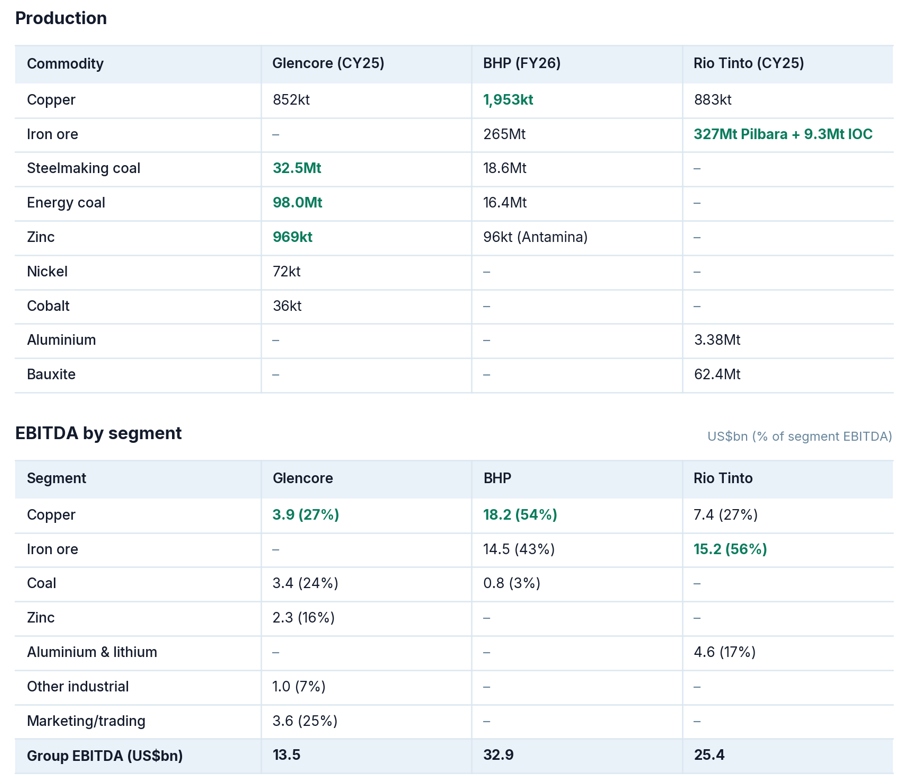
Glencore is unique among the majors. It has zero iron ore exposure, the same copper aspirations as BHP and Rio Tinto, a trading arm and chunky coal exposure. It's also cheaper, trading at ~5x FY27e EV/EBITDA vs. BHP and Rio Tinto at around 8x.
A few things to think about:
Copper: Glencore wants copper to become its biggest earnings driver, targeting roughly 50% of the earnings mix by 2030. It aims to get back above 1Mt by end-2028 and reach 1.6Mt by 2035. Its October presentation shows that would make Glencore a top-five copper producer in 2029, ahead of Rio Tinto but behind BHP, Codelco and Freeport.
Coal: Glencore mines six times BHP’s energy coal tonnage, and coal accounts for about a quarter of its earnings. Steelmaking coal made up 57% of coal EBITDA in 2025 and is forecast to reach 59% in 2026. Glencore says its energy coal averages 5,710 kcal NAR against a seaborne average of 4,880, and that quality premium helps explain its margins relative to smaller ASX coal names.
Marketing: No other ASX miner has a trading arm. Glencore’s spans commodity broking, logistics, network and supply chain management, and delivers about a quarter of earnings.
Below is a side-by-side breakdown of what the three majors produce and how their earnings stack up.
Best of Livewire
Here are some of my favourite reads from our friends at Livewire.
Buy Hold Sell – Are these moats still holding? Rudi and Henry split on Data#3, TechnologyOne and Fisher & Paykel, agreeing only on Mader. Picks: Meteoric as a backdoor into Lynas, and Macquarie.
A nation of investors: A record 11.5 million Australians now invest outside home and super. ETF ownership has doubled since 2020, and women make up 61% of those planning to start.
4 ASX small caps to back in a market that’s looking away: NAOS’s Sebastian Evans calls small-cap investing “a dying breed” and says that’s the opportunity. He likes XRF, SomnoMed, MaxiPARTS and Move Logistics.
ASX for yield, US for growth: Sebastian Ferrando revisits his 2023 call with fresh numbers: ASX 200 up 19% over five years against 93% for a 50-50 S&P 500 and Nasdaq blend. Franking can’t bridge that.
My lessons from a negative 7% year: Seneca returned 4.96% against a benchmark down 6.74%. Luke Laretive credits active trading and special situations, and writes Matsa down to zero.
Peak chart crime
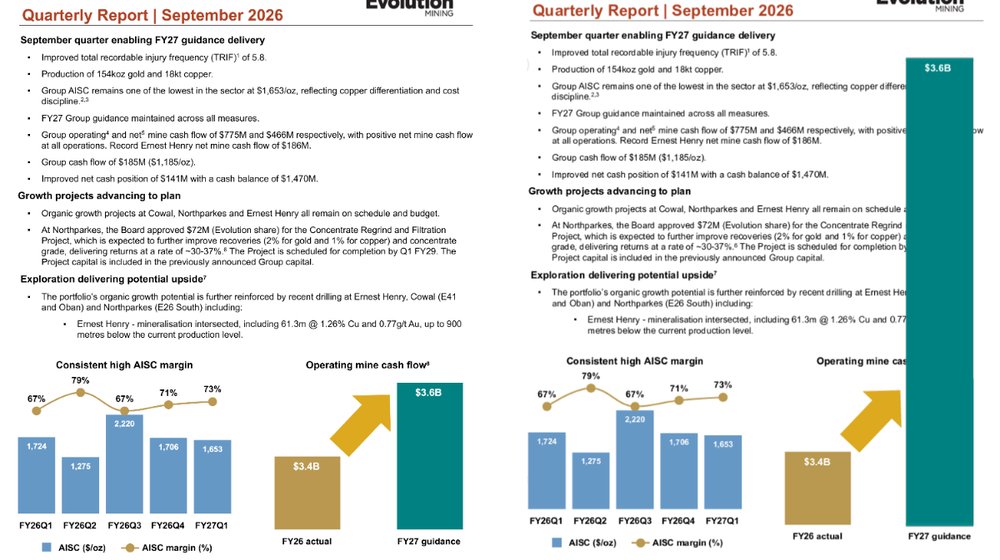
On a side note, even companies as big as Evolution Mining ($26 billion market cap) like to juice the visuals.
The original announcement (left) has operating mine cash flow going from $3.4 billion in FY26 to a guided $3.6 billion in FY27. But if you take that guidance bar literally, it’s probably closer to $7 billion.
If you’re committing a chart crime, you might as well go all the way (right). C’mon guys.
Last laughs
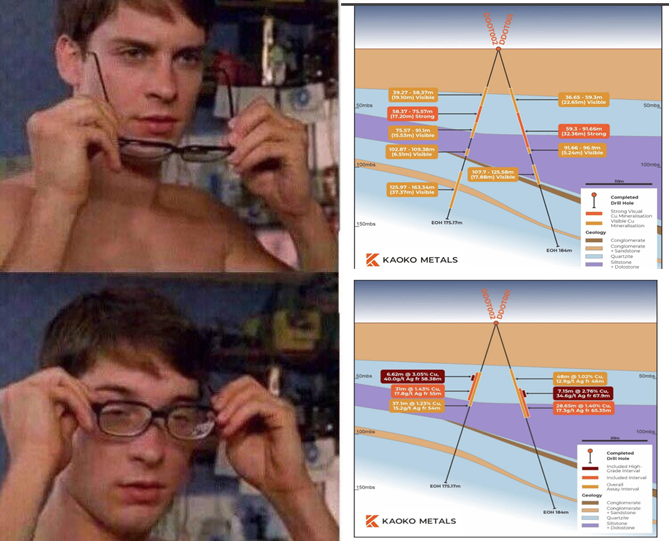
Kaoko Metals quickly hit 10-bagger status just months after its May IPO. This was largely off the back of thick visual copper intersections on 2 September, which sent the stock up ~240% from 74 cents to $2.50 in just two days.
The assays came back on Monday, and the stock plunged 56%. Another reminder that visual/XRF estimates are no substitute for assays.